Every software system carries a history. 📜 Over years, requirements shift, features accumulate, and patches pile on. The result is often a codebase that works but feels like a puzzle with missing pieces. This is the state of legacy code. It functions, yet it resists change. Developers hesitate to touch it, fearing unintended side effects. The silence of the repository often masks a loud problem: technical debt.
Refactoring is not just about rewriting code; it is about restoring understanding. When logic is hidden deep within nested loops and obscure variable names, the only way forward is visualization. This is where UML Activity Diagrams become essential. They translate abstract execution flow into a visual language that teams can inspect, critique, and improve.
This guide explores how to move from chaos to clarity. We will look at mapping existing logic to diagrams, identifying bottlenecks, and structuring a refactoring strategy that prioritizes stability over speed. No magic tools, no hype. Just systematic engineering practices.
🌪️ Why Legacy Code Becomes Chaos
Legacy systems are not inherently bad. They are systems that have aged. The chaos arises from the gap between the original intent and the current reality. Several factors contribute to this drift:
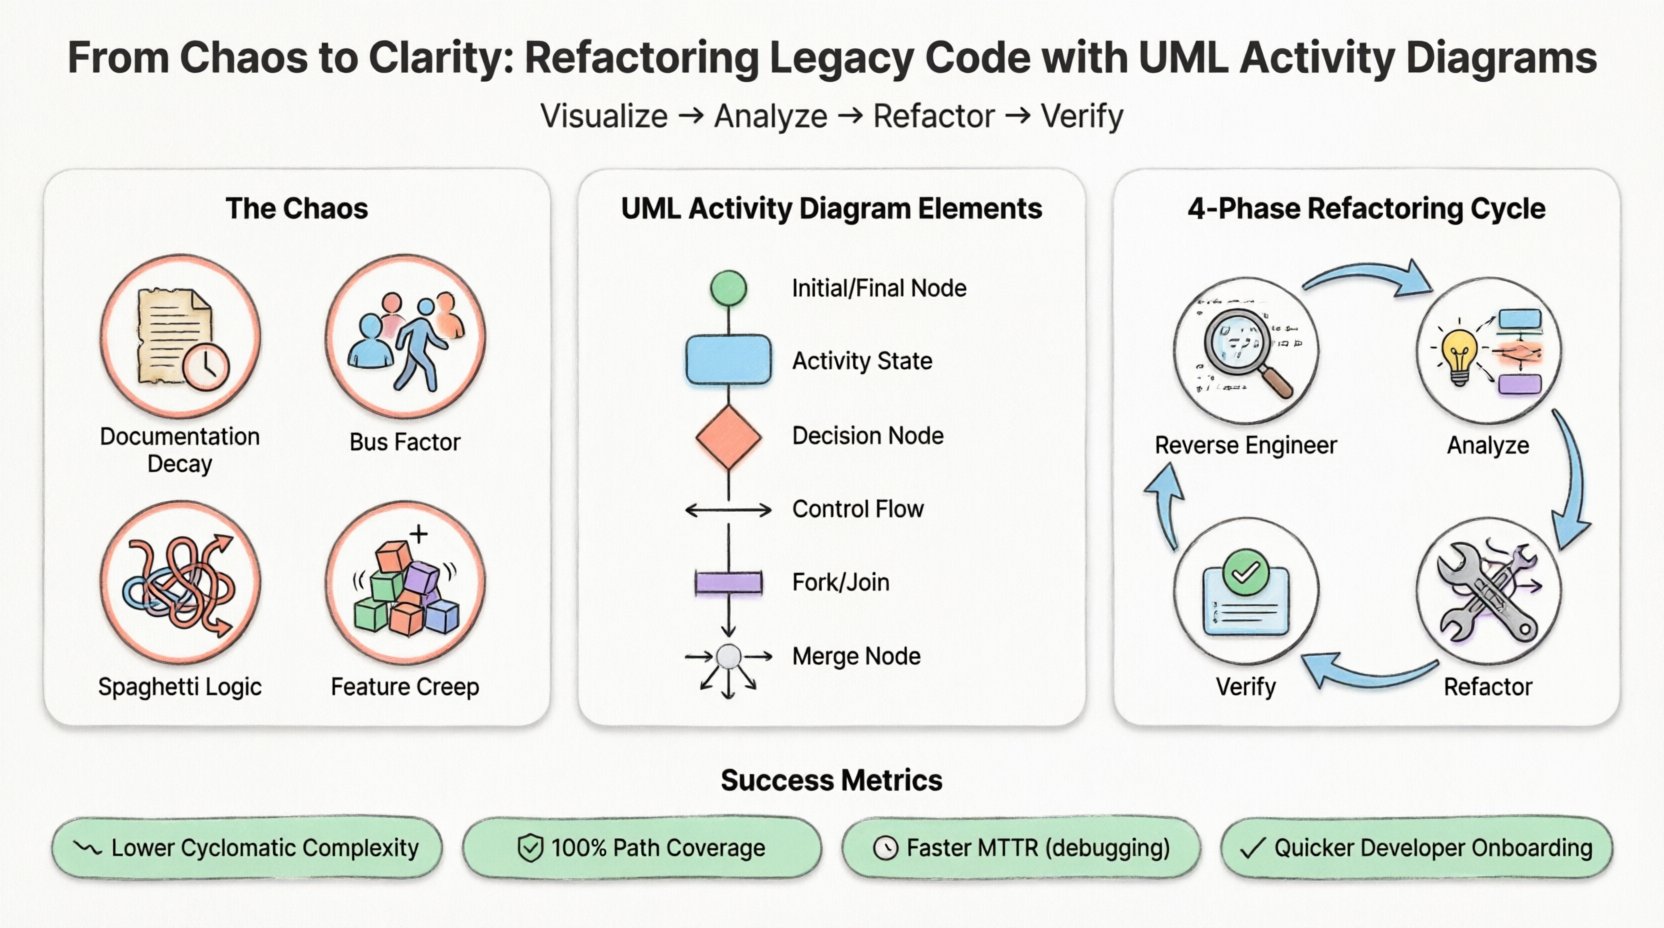
- Documentation Decay: Written specs become outdated as soon as the first commit is pushed. What was true yesterday is false today.
- Bus Factor: Knowledge exists only in the heads of a few senior engineers. When they leave, the system becomes a black box.
- Spaghetti Logic: Conditional statements nested three levels deep make it impossible to trace the path of execution without running the debugger.
- Feature Creep: New requirements are bolted onto old structures rather than integrated cleanly.
When a developer needs to modify a payment processing module, they might not know if a specific condition triggers a database rollback or an email notification. Guessing leads to bugs. Visualizing the flow removes the guesswork.
📊 Understanding UML Activity Diagrams
UML Activity Diagrams are behavioral diagrams that describe the dynamic aspects of a system. While class diagrams show structure, activity diagrams show flow. Think of them as sophisticated flowcharts that support concurrency, decision points, and object flows.
For refactoring, the diagram acts as a source of truth. It represents the behavior of the code, independent of the specific programming language. This abstraction is crucial because it allows the team to focus on logic rather than syntax.
Key Elements for Refactoring
To effectively model legacy systems, you must understand the core symbols. These elements map directly to programming constructs:
- Initial Node: The entry point of the activity. In code, this is the function or method signature.
- Activity State: A period of processing. This maps to a block of code, a function call, or a loop body.
- Control Flow: The arrows connecting nodes. These represent the sequence of execution.
- Decision Node: A diamond shape. This corresponds to
if,else, orswitchstatements. Each outgoing edge has a guard condition. - Merge Node: Where multiple flows converge back into one path.
- Fork/Join: These represent parallel execution. Critical for systems handling threads or asynchronous tasks.
- Final Node: The termination point. Code returns or exits.
Using these elements, you can reverse engineer a system. You read the code, extract the logic, and draw the diagram. Once drawn, the diagram becomes the blueprint for the refactored version.
🔄 The Process: Mapping Logic to Flow
Refactoring with diagrams is a four-phase cycle: Reverse Engineer, Analyze, Refactor, and Verify. Each phase requires discipline.
Phase 1: Reverse Engineering
Start with the critical paths. Do not attempt to diagram every line of code. Focus on the high-value workflows. For example, if the system handles user authentication, diagram the login, token generation, and session validation.
- Select the Entry Point: Identify the API endpoint or the main entry function.
- Trace the Execution: Follow the code path. Note every branch.
- Record Variables: Note where data is created, modified, or destroyed. Object flows help track state changes.
- Identify External Dependencies: Mark calls to databases, APIs, or file systems as separate swimlanes or actions.
Phase 2: Analyze and Identify Debt
Once the diagram is sketched, look for patterns that indicate poor design. Visual anomalies often point to technical debt.
| Visual Pattern | Code Implication | Refactoring Action |
|---|---|---|
| Highly interconnected nodes (Dense Clusters) | Coupled logic, hard to isolate | Extract methods, create interfaces |
| Multiple decision nodes in a row | Complex conditionals | Guard clauses or Strategy Pattern |
| Parallel flows without synchronization | Concurrency issues, race conditions | Implement locks or thread pools |
| Long, unbroken chains | Monolithic functions | Break into smaller sub-activities |
By spotting these patterns, you prioritize which parts of the code need immediate attention. A dense cluster might be the root cause of frequent bugs.
🛠️ Step-by-Step Refactoring Strategy
With the diagram in hand, you can plan the refactor. The goal is to maintain functionality while improving structure. The diagram serves as the contract. As long as the new code produces the same diagram, the behavior is preserved.
- 1. Isolate the Logic: Create a new module or package. Do not modify the old code directly.
- 2. Implement the Simplified Flow: Write code that matches the cleaned-up version of the diagram.
- 3. Write Tests: Use the diagram to generate test cases. Every path in the diagram should correspond to a test case.
- 4. Parallel Run: If possible, route traffic to both the old and new systems. Compare outputs.
- 5. Cut Over: Once verified, switch the entry point to the new implementation.
This approach is safer than trial-and-error. If the new code fails, the diagram shows exactly where the logic diverged from the expected flow.
⚠️ Common Pitfalls and How to Avoid Them
Even with a plan, refactoring legacy systems is fraught with risk. Here are common traps and how to navigate them.
Pitfall 1: Over-Diagramming
Creating a diagram for every single function can overwhelm the team. It consumes time and creates maintenance overhead for the documentation itself.
- Solution: Adopt a top-down approach. Diagram the system level first, then drill down into specific modules only when necessary.
Pitfall 2: Ignoring State
Activity diagrams focus on flow, but state matters. A function might behave differently based on global variables or database state.
- Solution: Use Object Flow lines to show data passing between activities. Annotate nodes with preconditions and postconditions.
Pitfall 3: Failing to Update
A diagram is only as good as its accuracy. If the code changes and the diagram does not, it becomes misleading documentation.
- Solution: Treat diagrams as code. Review them during pull requests. If the logic changes, the diagram must change.
📈 Measuring Success
How do you know the refactoring worked? Metrics provide the answer. Visual clarity should translate to tangible improvements in development velocity and system stability.
- Code Complexity: Use cyclomatic complexity tools. The refactored code should show lower complexity scores compared to the legacy version.
- Test Coverage: With a complete activity diagram, you can identify untested paths. Aim for 100% path coverage on critical flows.
- Mean Time to Recovery (MTTR): If a bug occurs, does the diagram help you find it faster? Reduced debugging time indicates better clarity.
- Onboarding Time: New developers should understand the system logic faster when the diagram is available.
🔄 Integrating Diagrams into CI/CD
Documentation often sits in a wiki and gets ignored. To make diagrams useful, they must be part of the build pipeline. This ensures they are never outdated.
- Automated Generation: Use tools that can generate diagrams from code comments or abstract syntax trees. This keeps the visual representation in sync with the source.
- Validation Checks: Integrate a step in the CI/CD pipeline that checks for diagram changes. If the code changes but the diagram does not, the build fails.
- Visual Regression: Store the reference diagrams in version control. Compare new diagram outputs against the baseline to detect logic drift.
This automation removes the burden of manual maintenance. The system enforces its own documentation standards.
🧩 Handling Concurrency and Parallelism
Legacy systems often rely on multithreading to handle performance. However, concurrency is notoriously difficult to understand. Sequential code is linear; concurrent code is a web.
UML Activity Diagrams handle this with Fork and Join nodes.
- Fork Node: Splits the control flow into multiple concurrent threads.
- Join Node: Waits for all incoming threads to complete before continuing.
When refactoring, ensure that your diagram accurately represents synchronization. If a legacy system uses a mutex, the diagram should reflect that a thread is blocked until a resource is free. This visual cue helps identify potential deadlocks before they happen in production.
Consider a scenario where a report generation process spawns multiple worker threads to calculate different sections of a dataset.
- The main thread forks into three parallel activities.
- Each activity processes a subset of data.
- They merge at a join node.
- The final activity aggregates the results.
If you refactor this, you must preserve the join logic. If you remove the join, the report might be sent before all data is ready. The diagram makes this requirement obvious.
📝 Final Thoughts on System Modernization
Refactoring legacy code is a long-term investment. It is not about quick fixes or patching holes. It is about rebuilding the foundation so the structure can support future growth.
UML Activity Diagrams provide the bridge between the old reality and the new design. They force the team to confront the actual logic of the system, rather than their assumptions about it.
By following a disciplined process, teams can reduce technical debt without introducing new bugs. The chaos of the past becomes the clarity of the future.
Start small. Pick one module. Draw the diagram. Refactor the flow. Verify the result. Repeat. This methodical approach builds confidence and ensures the system remains stable throughout the transformation.