
Introduction
Computational thinking is not about programming a computer. It is a way of approaching problems—any problem—with the disciplined habits of a computer scientist. The four techniques at its core are decomposition, abstraction, pattern recognition, and algorithms . They are often described as the legs of a table: remove one, and the whole structure becomes unstable .
Flowcharts make these techniques visible. By mapping a problem’s structure onto a diagram of shapes and arrows, teams can see where a problem has been broken down well, where detail has been properly stripped away, where a repeated pattern has been exploited, and where the step-by-step logic is sound. This guide explains each technique, illustrates it with concrete examples, and shows how to model the result using Visual Paradigm, a diagramming platform that supports flowcharting alongside structured modeling tools .
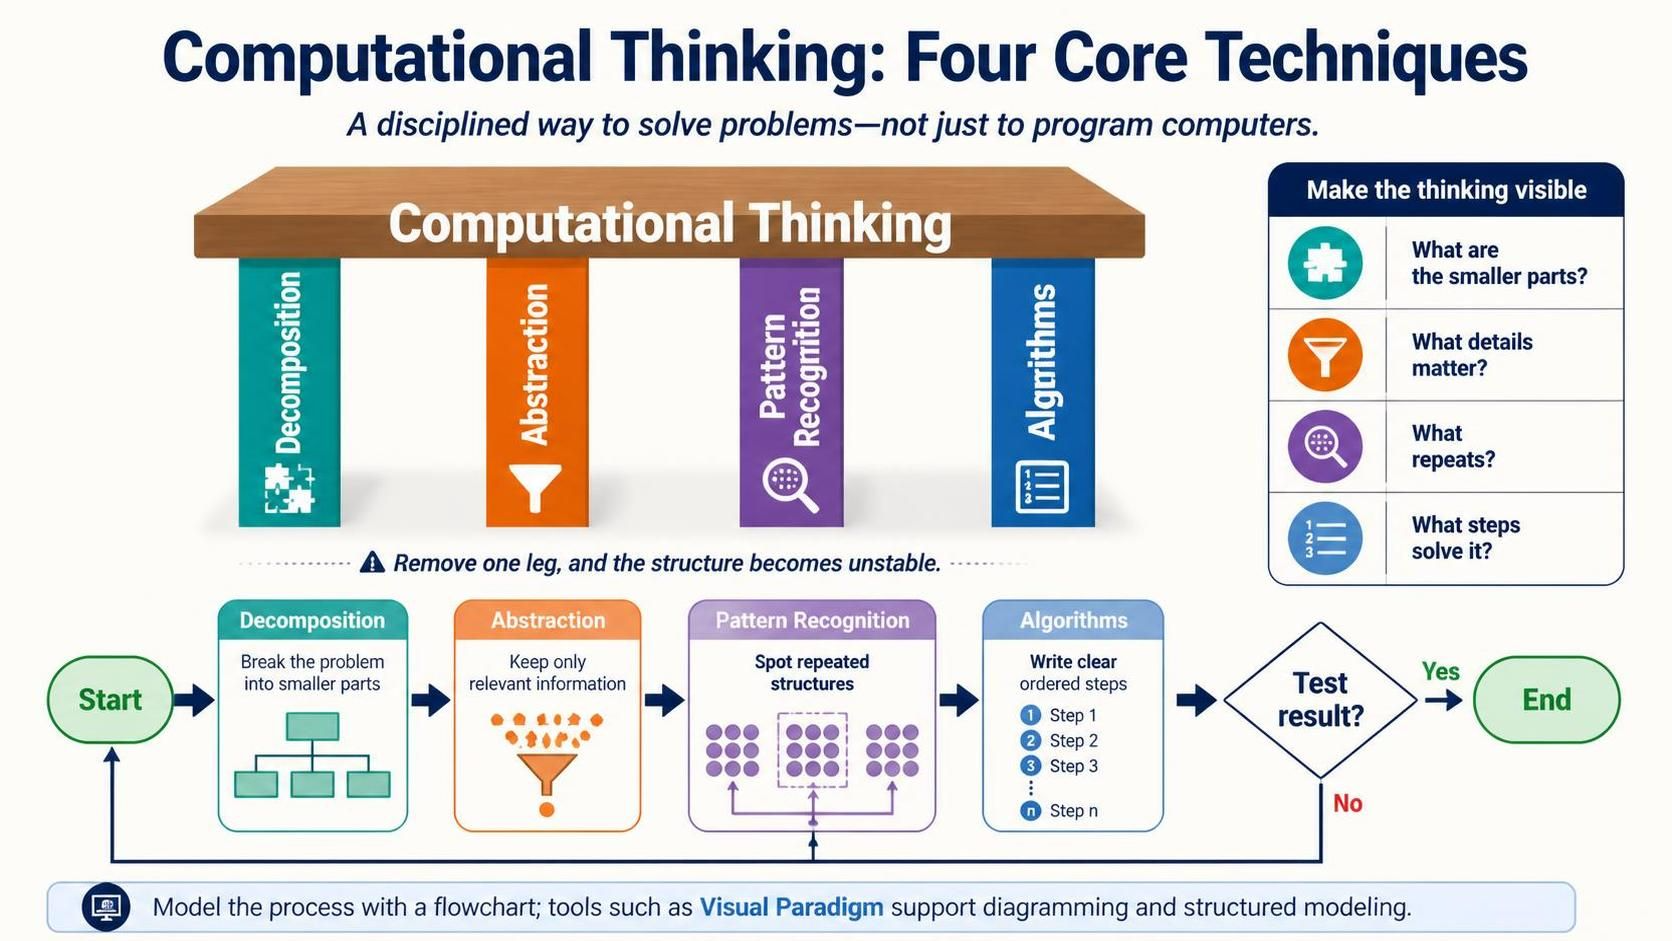
Key Concepts of the Four Techniques
1. Decomposition
Definition. Decomposition is the act of breaking a complex problem or system into smaller, more manageable parts . The smaller parts can be solved individually, and their solutions combined to address the original problem .
Why it matters for flowcharts. A flowchart of an undecomposed problem becomes an unreadable tangle of boxes. Decomposition gives you natural boundaries: each sub-process can become its own swimlane, sub-page, or reusable component.
Example. Consider the problem of calculating the total surface area of a rectangular box. Rather than attacking the formula directly, decompose the box into its six faces: top, bottom, front, back, left, and right. Each face is a rectangle whose area is simple to compute. The final algorithm becomes a sum of six sub-results .
Visual Paradigm application. Use Subprocess shapes or swimlanes to represent decomposed modules. Visual Paradigm’s flowchart designer supports swimlanes and cross-functional diagrams, making the boundaries between decomposed parts explicit .
2. Abstraction
Definition. Abstraction means focusing on the important information only and ignoring irrelevant detail . It is what lets you treat a car’s brake pedal as “the thing that slows the car” without knowing the hydraulic pressure curve.
Why it matters for flowcharts. A flowchart that includes every variable initialization and memory address is useless for communication. Abstraction determines what belongs in the diagram and what stays in the code.
Example. A flowchart for a “buy chocolate” process does not need to model the shopkeeper’s inventory system, the payment network’s authorization protocol, or the molecular composition of the chocolate. It needs five steps: think of chocolate, visit shop, pay shopkeeper, take chocolate, return home . Everything else is irrelevant detail at this level of abstraction.
Visual Paradigm application. Use composite structure or drill-down features sparingly. The top-level flowchart shows only the abstracted steps; detailed sub-diagrams exist but are hidden until needed. Visual Paradigm’s support for reusable component pages allows a single abstracted process to be embedded across multiple documentation contexts without duplication .
3. Pattern Recognition
Definition. Pattern recognition is the search for similarities among and within problems . Once a pattern is identified, a solution developed for one instance can be reused for others.
Why it matters for flowcharts. Patterns manifest as repeated substructures: the same decision diamond appearing three times, the same loop construct, the same input-validate-process-output sequence. Recognizing them prevents redundant work and reveals opportunities for simplification.
Example. In the box-surface-area problem, after decomposition you have six rectangles. Pattern recognition reveals that the top and bottom are identical in size, the front and back are identical, and the left and right are identical. The algorithm collapses from six independent area calculations to three multiplied by two .
In flowcharting, pattern recognition appears when you notice that a “validate user input” subroutine is needed at three different points. Instead of drawing it three times, you extract it into a reusable subprocess.
Visual Paradigm application. Visual Paradigm’s template library (over 1,000 diagram templates) embodies pattern reuse . More directly, the tool’s support for reusable flowchart components lets you define a pattern once and insert it wherever it recurs .
4. Algorithms
Definition. An algorithm is a step-by-step solution to a problem, or the set of rules to follow to solve it . It is the output of the first three techniques: decomposition gave you the parts, abstraction told you which parts matter, pattern recognition showed you what can be reused, and the algorithm puts them in order.
Why it matters for flowcharts. A flowchart is, by definition, a diagrammatic representation of an algorithm . The algorithm is the logic; the flowchart is its visual form.
Example. An algorithm to find the maximum of two numbers:
-
Input A and B.
-
If A > B, then A is the maximum; otherwise B is the maximum.
-
Print the maximum.
As a flowchart, this becomes: oval (Start) → parallelogram (Input A, B) → diamond (A > B?) → two branches to parallelograms (Print A / Print B) → oval (End) . The diamond is the decision; the parallelograms are input/output; the rectangles (implicit here) are processes.
Visual Paradigm application. Visual Paradigm provides the standard flowchart symbol set: oval for start/end, rectangle for process, diamond for decision, parallelogram for input/output, and arrows for flow . The AI-powered generation feature can convert a bulleted algorithm description into a draft flowchart, which you then refine on the canvas . For teams that prefer text-based modeling, Visual Paradigm also supports Mermaid diagram-as-code for flowcharts, useful for version-controlled logic .
Integrating the Four Techniques in a Single Flowchart
The power of computational thinking comes from applying all four techniques in sequence. Consider a simple troubleshooting flowchart for a lamp that does not work :
| Technique | Application |
|---|---|
| Decomposition | Break “lamp doesn’t work” into: Is it plugged in? Is the bulb burned out? Is the switch on? |
| Abstraction | Ignore the wiring diagram, the fuse box model, and the lamp’s manufacturer. Focus only on the observable conditions. |
| Pattern Recognition | Notice that “check a connection” appears twice: the power plug and the bulb socket. Treat both as “check connection.” |
| Algorithms | Order the checks: plugged in → bulb burned out → replace bulb; else repair lamp. |
The resulting flowchart has a clear start, a decision diamond, two branches, and an end. It is simple because the thinking behind it was disciplined.
Tooling: Using Visual Paradigm for Computational Flowcharts
Visual Paradigm supports the full lifecycle of a computational-thinking flowchart, from decomposition to final algorithm.
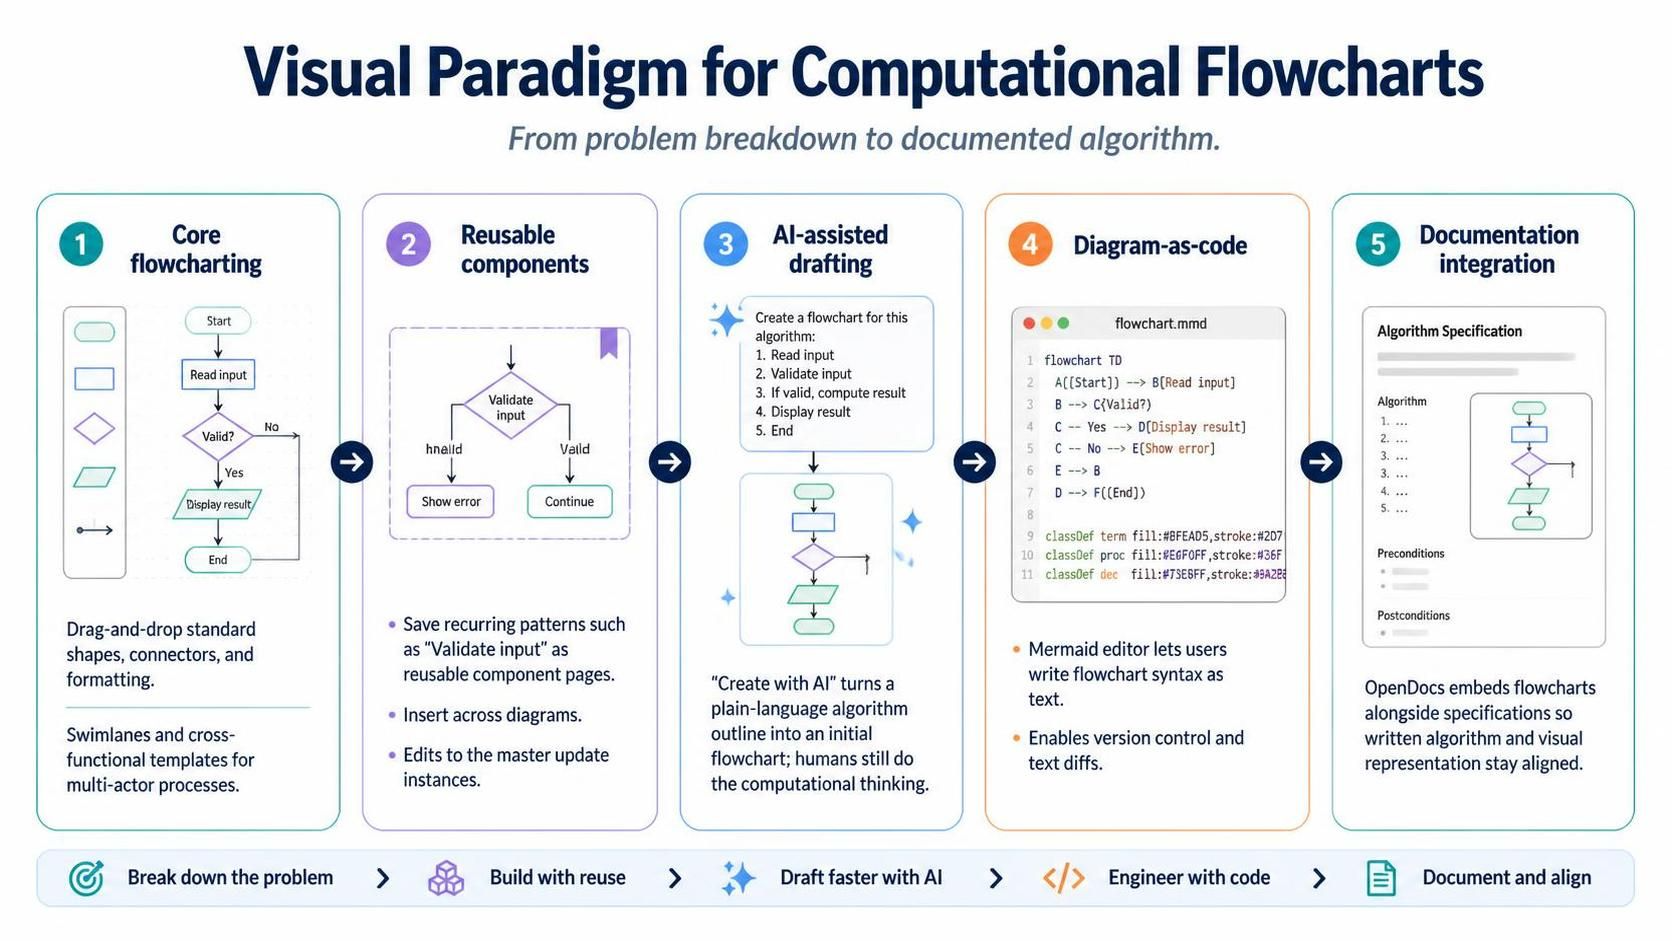
Core flowcharting. The Flowchart Designer provides drag-and-drop shapes, connectors, and formatting controls for standard process diagrams . Swimlanes and cross-functional flowchart templates support decomposed, multi-actor processes .
Reusable components. A flowchart that represents a recurring pattern (e.g., “validate input”) can be saved as a reusable component page and inserted into multiple documents or diagrams. Changes to the master update all instances .
AI-assisted drafting. The Create with AI function accepts a plain-language outline of an algorithm and generates an initial flowchart with appropriate shapes and connections. This accelerates the transition from algorithm description to visual model, leaving the computational thinking to the human .
Diagram-as-code. For algorithm-heavy work where text diffs matter, Visual Paradigm’s Mermaid editor supports flowchart syntax, allowing decision logic to be written and version-controlled as plain text .
Documentation integration. Through OpenDocs, flowcharts can be embedded directly alongside written specifications, so the abstracted algorithm and its visual representation stay synchronized .
Example Section: Modeling a Computational-Thinking Flowchart in PlantUML
This section walks through a complete worked example. It takes a problem, applies the four techniques of computational thinking, and renders the result as a flowchart using PlantUML code. The flowchart models a student grade calculator: given a numeric score, decide the letter grade and whether the student passes.
Step 1 — Decomposition
Break the problem into smaller, manageable parts:
-
Input handling — receive the numeric score and validate it is between 0 and 100.
-
Grade determination — map the score to a letter grade (A, B, C, D, or F).
-
Pass/fail decision — determine whether the grade is a pass (A–D) or a fail (F).
-
Output — display the grade and the pass/fail status.
Each part becomes a distinct region of the flowchart, which keeps the diagram readable and lets each block be verified independently.
Step 2 — Abstraction
Strip away irrelevant detail. The flowchart does not model:
-
How the score is entered (keyboard, file, API).
-
The database schema storing student records.
-
The exact rounding rules for decimal scores.
-
Formatting of the output message.
It models only: score in → validation → grade mapping → pass/fail → result out.
Step 3 — Pattern Recognition
The grade mapping has a repeated structure: each boundary is a decision of the form “score ≥ threshold?”. Recognizing this pattern lets us represent the logic as a clean cascade of decision diamonds rather than ad-hoc branching. The same “check boundary” pattern recurs for A, B, C, and D, with F as the default.
Step 4 — Algorithms
The ordered algorithm:
-
Start.
-
Input
score. -
If
score < 0orscore > 100, output “Invalid score” and end. -
If
score ≥ 90, grade = A. -
Else if
score ≥ 80, grade = B. -
Else if
score ≥ 70, grade = C. -
Else if
score ≥ 60, grade = D. -
Else grade = F.
-
If grade = F, status = “Fail”; otherwise status = “Pass”.
-
Output grade and status.
-
End.
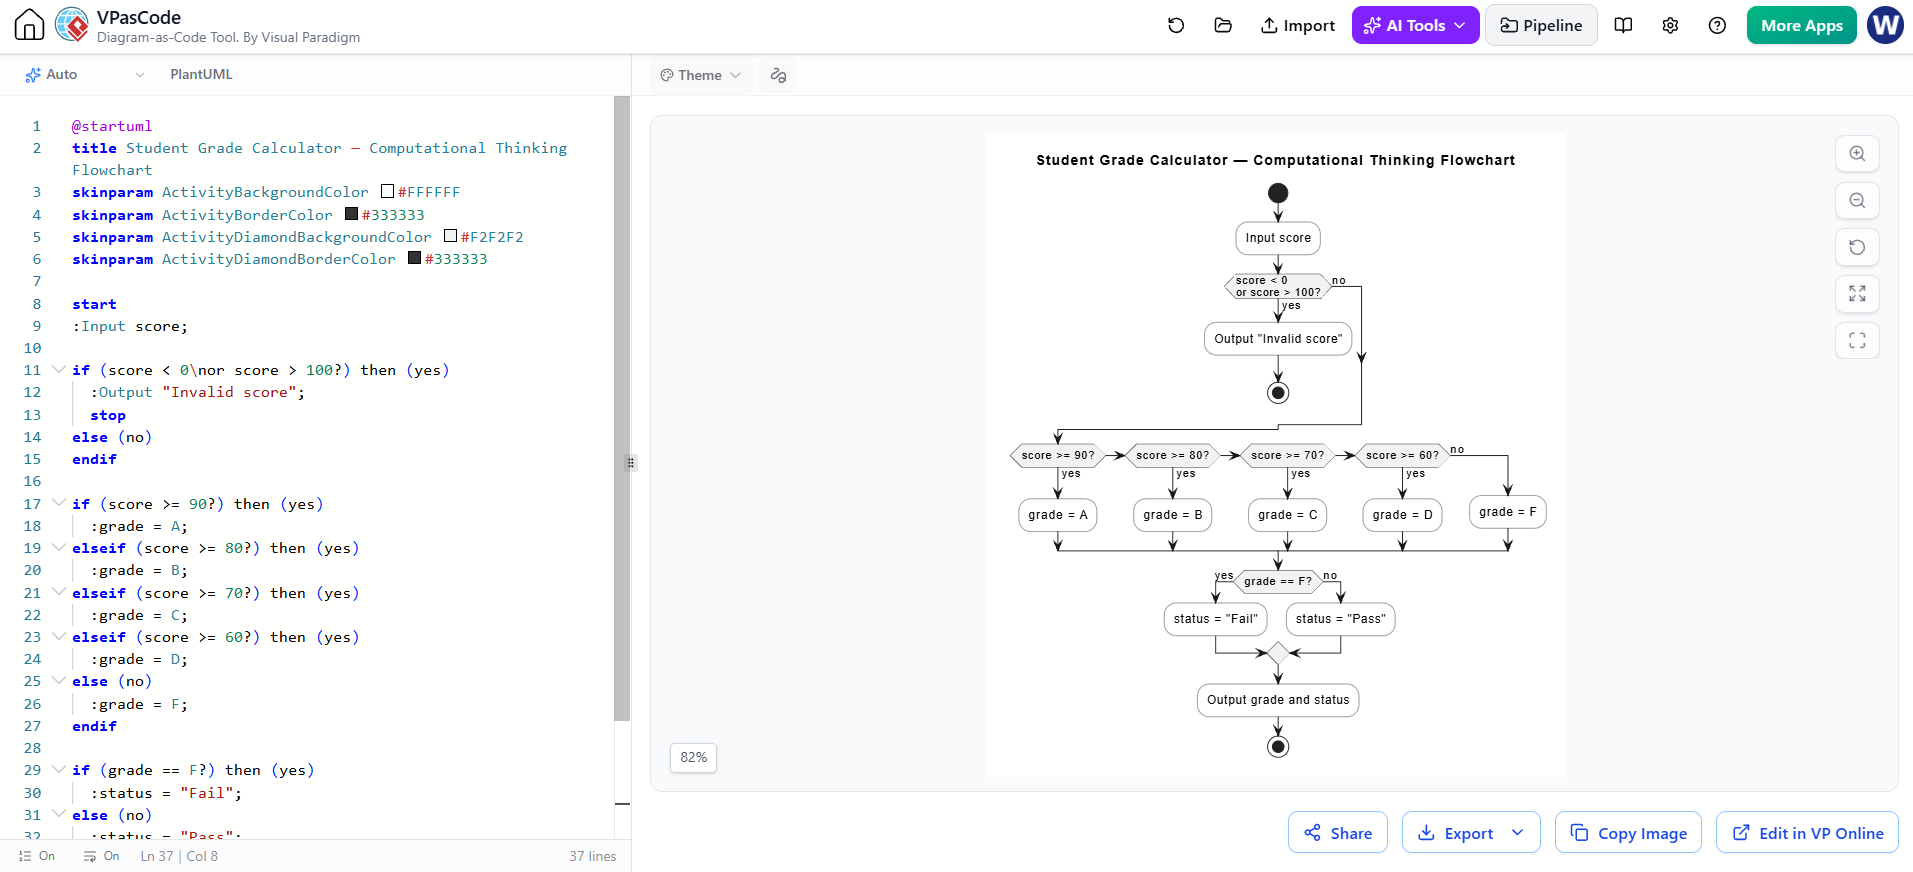
PlantUML Flowchart
@startuml
title Student Grade Calculator — Computational Thinking Flowchart
skinparam ActivityBackgroundColor #FFFFFF
skinparam ActivityBorderColor #333333
skinparam ActivityDiamondBackgroundColor #F2F2F2
skinparam ActivityDiamondBorderColor #333333

start
:Input score;

if (score < 0\nor score > 100?) then (yes)
  :Output "Invalid score";
  stop
else (no)
endif

if (score >= 90?) then (yes)
  :grade = A;
elseif (score >= 80?) then (yes)
  :grade = B;
elseif (score >= 70?) then (yes)
  :grade = C;
elseif (score >= 60?) then (yes)
  :grade = D;
else (no)
  :grade = F;
endif

if (grade == F?) then (yes)
  :status = "Fail";
else (no)
  :status = "Pass";
endif

:Output grade and status;
stop
@enduml
Reading the Diagram Through the Four Techniques
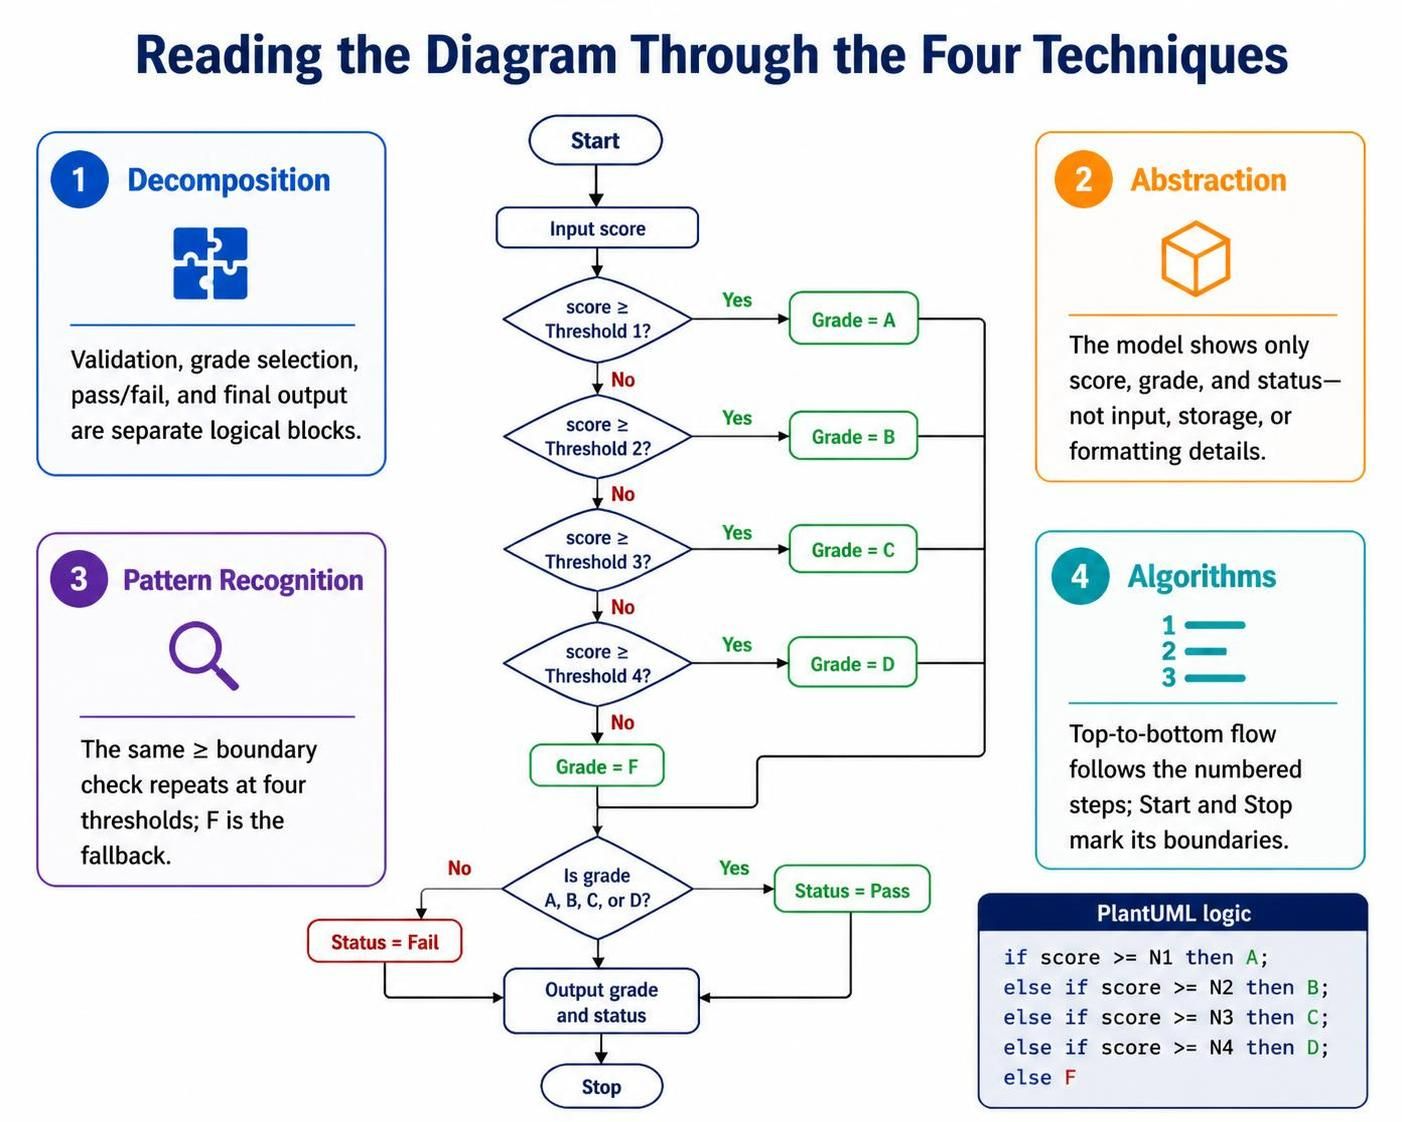
| Technique | Where it appears in the PlantUML code |
|---|---|
| Decomposition | Four logical blocks: the validation if, the grade cascade, the pass/fail if, and the final output. Each block is a self-contained activity or decision group. |
| Abstraction | Only score, grade, and status appear. No input method, storage, or formatting detail is modeled. |
| Pattern Recognition | The repeated if (score >= N?) cascade — the same boundary-check pattern applied at four thresholds, with F as the fallback. |
| Algorithms | The top-to-bottom flow order is exactly the numbered algorithm in Step 4. The start/stop brackets mark the algorithm’s boundaries. |
Rendering Notes
-
Activity beta syntax (
:activity;,if (...) then (...)) is the current PlantUML standard for flowcharts and produces clean, readable output. -
\ninside decision labels keeps long conditions from stretching the diamond horizontally. -
elseifchains mirror the algorithm’s “else if” cascade one-to-one, which makes the diagram verifiable against the written algorithm. -
For teams using Visual Paradigm, the same logic can be recreated with swimlanes (one lane per decomposed block) or imported as a Mermaid draft and refined on the canvas, as discussed in the main guide.
Conclusion
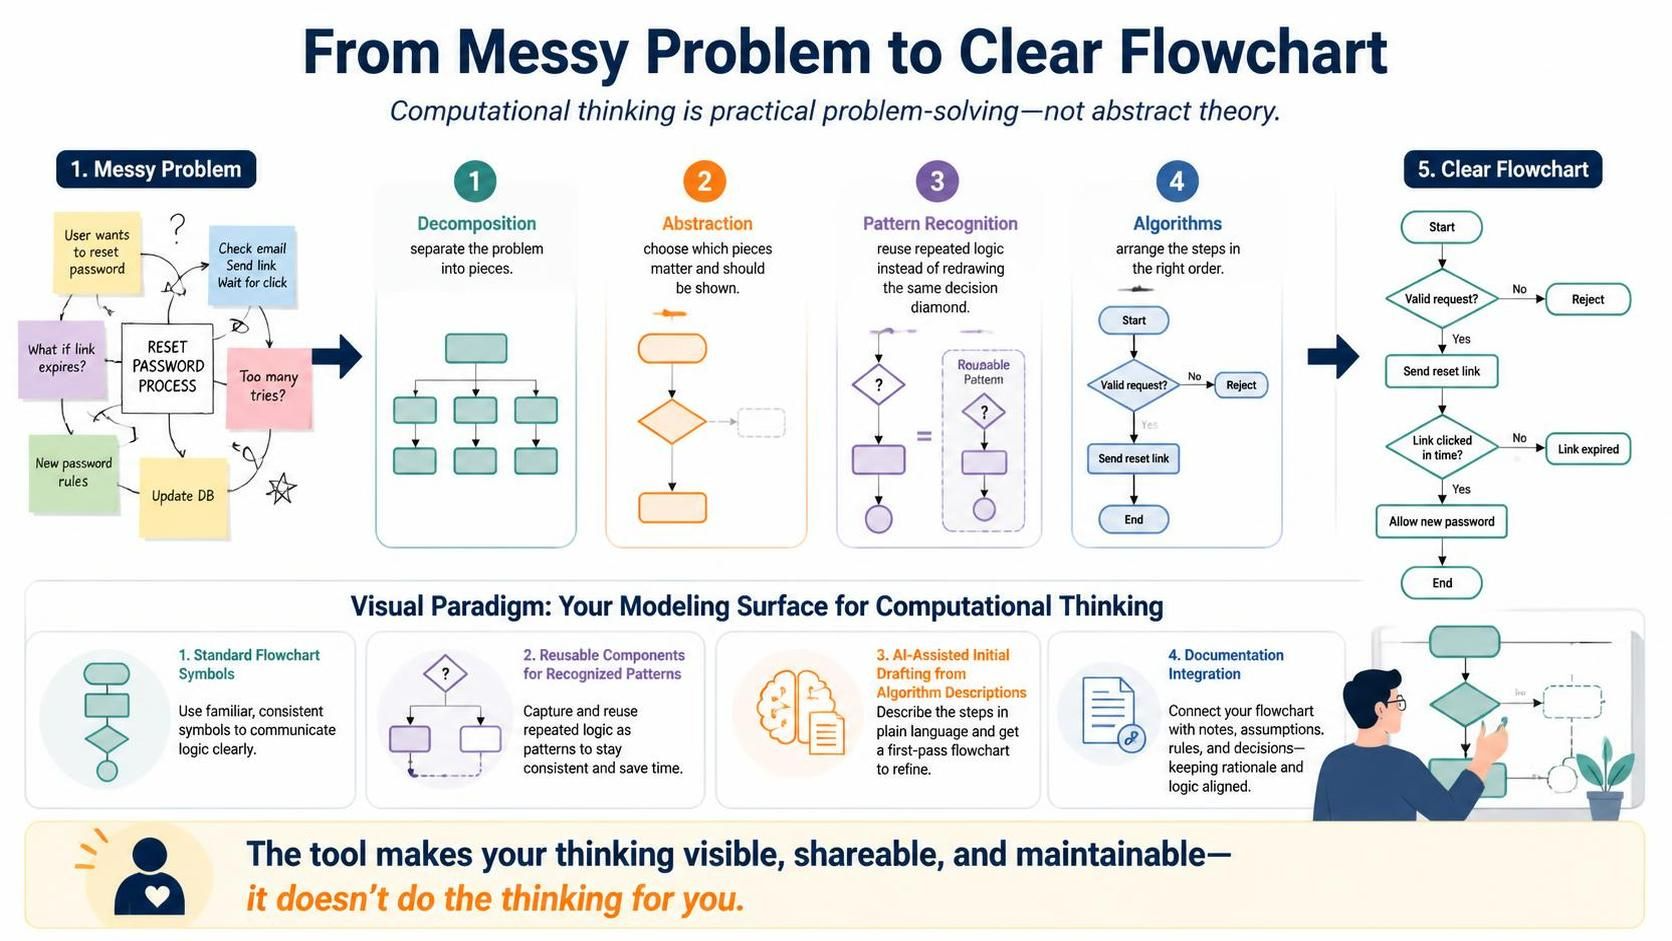
The four techniques of computational thinking—decomposition, abstraction, pattern recognition, and algorithms—are not abstract theory. They are the practical steps that turn a messy problem into a clear flowchart. Decomposition gives you the pieces. Abstraction tells you which pieces to show. Pattern recognition saves you from redrawing the same diamond five times. Algorithms put the pieces in the right order.
Visual Paradigm serves this process by providing the modeling surface: standard flowchart symbols, reusable components for recognized patterns, AI-assisted drafting from algorithm descriptions, and documentation integration that keeps the visual model tied to the thinking behind it. The tool does not do the computational thinking for you, but it makes the results of that thinking visible, shareable, and maintainable.
-
AI Stepwise Flowchart Generator | Visual Paradigm AI Chatbot: Introduces the AI chatbot’s stepwise flowchart feature, which generates phased, clustered process maps from natural language descriptions and supports conversational refinement with automatic step renumbering and connection adjustments.
-
Introduce Stepwise Flowcharts: AI-Powered Process Mapping: Official release announcement for the stepwise flowchart feature, demonstrating AI-generated color-coded workflow phases using a customer service process example, and covering VPasCode editing and OpenDocs publishing integration.
-
How to Create Flowcharts with AI in Visual Paradigm Online OpenDocs: Tutorial on generating flowcharts with AI in the OpenDocs document environment, covering both reusable component pages and single-page insertion methods, emphasizing the tight integration of process models with technical documentation.
-
How to Generate Flowcharts Using AI in Visual Paradigm: Step-by-step walkthrough of AI flowchart generation in the desktop version, covering the workflow from text outline input to automatic layout, with standardized application of shapes such as processes, decisions, and input/output.
-
How to Create BPMN Business Process Diagrams in Visual Paradigm: Detailed BPMN diagram creation tutorial for the desktop version, covering Pools/Lanes organization, Resource Catalog rapid connections, gateway types, and process simulation animation analysis.
-
Modeling BPMN Diagrams with Visual Paradigm Desktop: BPMN modeling guide focused on practical operations, covering event/task/gateway placement, swimlane organization, smart connections, validation rules, and multi-format export.
-
AI BPMN Diagram Generator Guide: Introduces the AI BPMN generator for the desktop version, supporting automatic generation of BPMN 2.0-compliant process diagrams from plain language descriptions, with optional automatic inclusion of Pools and Lanes, and subsequent manual refinement using professional editing tools.
-
How AI Is Transforming Business Process Modeling (BPM): Explores the value of AI in BPM, covering rapid prototyping, reduction of structural errors, conversational iterative optimization, and the necessity of linking AI-generated drafts with system architecture and data models within an integrated modeling ecosystem.
-
Online BPMN Tool: Feature overview page for the online BPMN tool, covering drag-and-drop editing, Visio import, MS Office integration, 2000+ templates, and real-time collaboration capabilities.
-
Next-Gen AI Diagram Chatbot V2 Launched: Introduces AI chatbot V2 upgrades, including automatic validation and self-recovery, flowchart and multi-diagram type support, the Artifacts Pane, and generated diagram explanations and analysis features.