


Creating a professional AI deployment diagram usually involves a lot of tedious clicking, dragging, and dropping. You have to figure out where the servers go, how they connect to the database, and which software artifacts live on which hardware node. It is often the most time-consuming part of system architecture documentation. However, the game has changed with the introduction of the AI diagram generator inside Visual Paradigm. By simply describing your system’s physical architecture in plain English, you can generate a fully standard-compliant UML deployment diagram in seconds.
This tool is perfect for system architects, DevOps engineers, and developers who need to visualize their infrastructure quickly without getting bogged down in layout details. Whether you are mapping out a cloud environment or a local server setup, this text-to-diagram software handles the heavy lifting for you.
Quick Summary: Key Takeaways
- Instant Visualization: Turn natural language descriptions of hardware and software into visual models immediately.
- Intelligent Inference: The AI automatically detects nodes (servers), artifacts (files), and execution environments from your text.
- Full UML Compliance: Generated diagrams use correct notation, including stereotypes like <<device>> and <<artifact>>.
- Editable Results: The output is a native Visual Paradigm diagram, fully editable for further refinement.
- Time Saver: Skips the manual layout phase, allowing you to focus on architectural logic rather than drawing lines.
Step 1: Describing Your Architecture
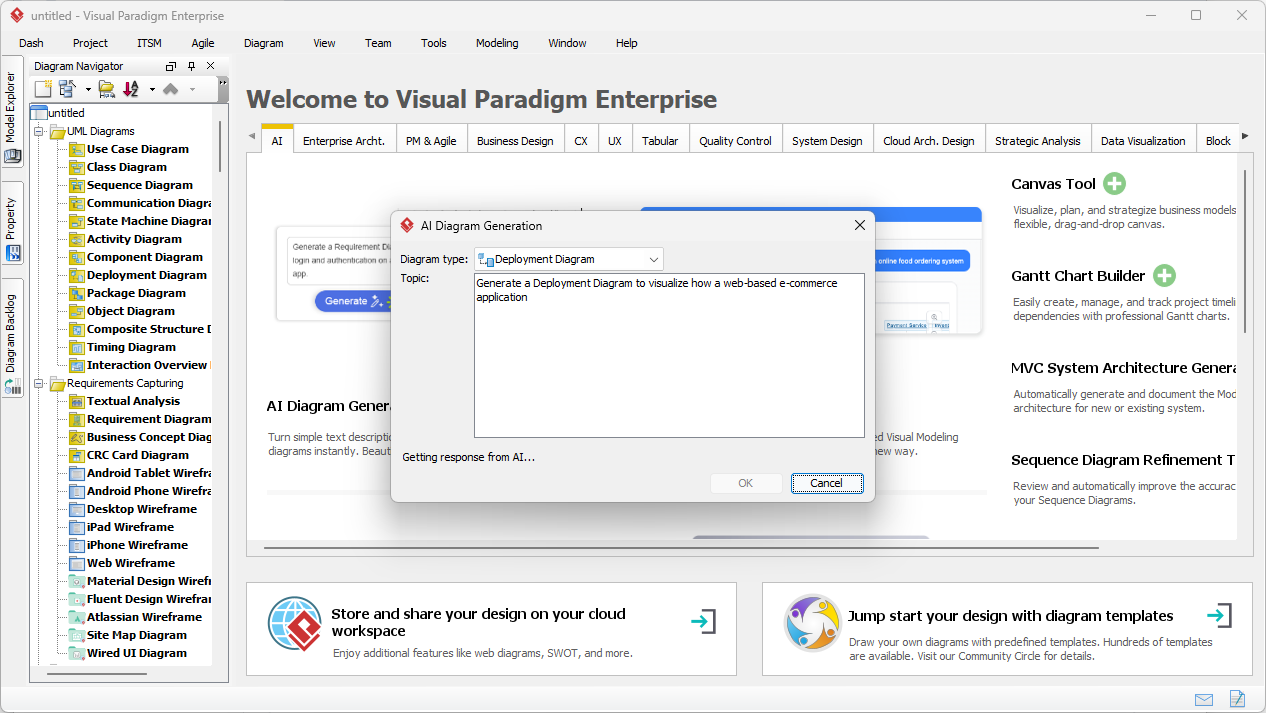
The process starts with a simple concept: if you can say it, you can draw it. In the past, you would open a blank canvas and stare at a palette of shapes. Now, you open the AI Diagram Generation tool. As shown in the workflow below, you simply select “Deployment Diagram” from the dropdown menu.
In the example provided, the user wants to see a setup for an online shop. They enter a prompt: “Generate a Deployment Diagram to visualize how a web-based e-commerce application…”. This text input is all the AI needs. It parses your words to understand that you need a web environment, likely a database, and client access points. It acts as a smart UML modeler that reads your mind based on your requirements.
Step 2: Analyzing the AI-Generated Result
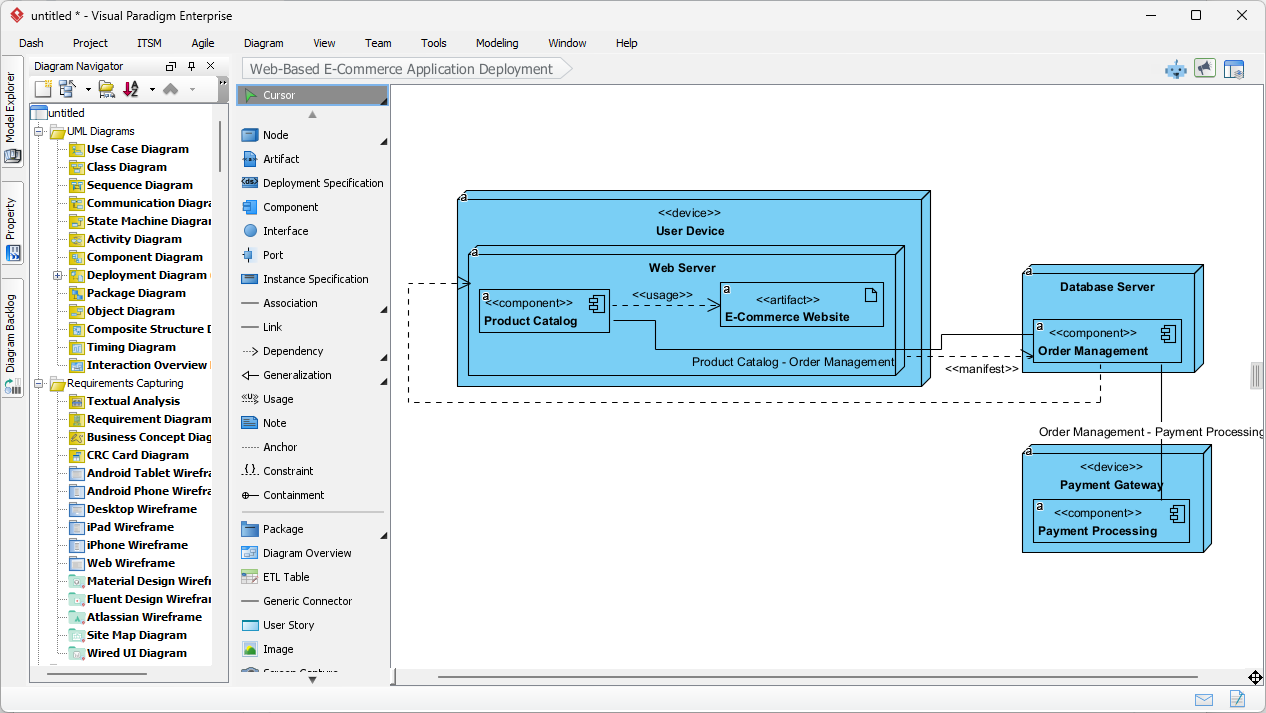
Once you click “Generate,” the AI builds the structure. It doesn’t just throw random boxes on the screen; it organizes them logically according to UML standards. Looking at the result below, you can see the AI successfully translated the concept of an “e-commerce application” into a structured reality.
The diagram automatically created distinct Nodes (the 3D boxes) representing the hardware and execution environments. You can see a “User Device” on the left, which connects to a “Web Server” in the middle, which then talks to a “Database Server” and an external “Payment Gateway.” Inside the Web Server node, the AI intelligently placed Artifacts and Components like the “Product Catalog” and “E-Commerce Website.” It even applied the correct dependency lines and stereotypes (like <<device>> and <<component>>), creating a professional-grade diagram that is ready for a stakeholder presentation.
How the AI Understands Deployment Logic
You might be wondering how the tool knows the difference between a server and a piece of code. This intelligent architecture tool uses context clues from your description.
Node vs. Artifact Detection
In UML, a Node is a physical resource—like a server, a router, or a mobile phone. An Artifact is the software or file that “lives” on that node. When you describe your system, the AI looks for hardware terms to create Nodes and software terms to create Artifacts. In our example image, it correctly identified “Web Server” as the container (Node) and the “E-Commerce Website” as the thing running inside it (Artifact).
Automatic Relationships
The AI also infers communication paths. It knows that a User Device typically connects to a Web Server, and a Web Server needs to fetch data from a Database Server. It draws these connection lines automatically, saving you the hassle of routing connectors manually. It ensures the flow of data looks logical from left (client) to right (backend).
Who Should Use This Tool?
This feature isn’t just for UML experts. It democratizes infrastructure modeling for various roles:
- Solution Architects: Quickly draft options for cloud vs. on-premise setups to show clients.
- DevOps Engineers: Document existing runtime environments or plan new deployment pipelines.
- Students & Teachers: Learn how deployment diagrams work by seeing how text translates to visual structure.
- IT Managers: Create clear visuals for audit documentation or compliance reviews without needing deep technical drawing skills.
Refining Your Diagram
The best part about this online diagramming solution is that the AI output is not a static image. It is a fully editable diagram. Once the AI generates the initial view (as seen in the second image), you can:
- Add Specifics: detailed IP addresses, specific hardware specs, or additional redundancy nodes.
- Change Layouts: Drag nodes around to fit a specific page size or layout preference.
- Link Models: Connect the deployment nodes to other diagrams in your project, such as Component or Class diagrams, ensuring your entire project documentation is synchronized.
Conclusion
Visual Paradigm’s AI Deployment Diagram Generation transforms the way we document physical systems. By converting natural language into precise, standard-compliant UML models, it removes the barrier to entry for deployment diagramming. It allows you to move from a mental concept to a concrete visual model in seconds, ensuring your infrastructure documentation is always clear, accurate, and up-to-date.
Ready to visualize your system architecture instantly? Download Visual Paradigm today and start generating professional deployment diagrams with the power of AI.
Related Links
A deployment diagram is a foundational UML tool used to visualize the physical distribution of software artifacts across various nodes, such as hardware or execution environments. Visual Paradigm provides an advanced toolset for these diagrams, featuring drag-and-drop modeling, real-time collaboration, and full integration with other UML standards. Modern architectural workflows are further enhanced by AI-powered generation for cloud applications and support for PlantUML code-based diagram construction.
-
What is a Deployment Diagram? – A Complete Guide to UML: An essential resource explaining the purpose, components, and best practices for modeling software system architecture.
-
Deployment Diagram Software Features – Visual Paradigm: An overview of capabilities including UML integration and collaborative features for professional modeling.
-
Deployment Diagrams in the Software Design Handbook: This guide offers practical insights into designing scalable and maintainable systems through structural deployment analysis.
-
Step-by-Step Deployment Diagram Tutorial: A hands-on tutorial that walks users through building diagrams from scratch, focusing on nodes, artifacts, and relationships.
-
Deployment Diagram Examples Gallery: A curated collection of real-world examples to inspire and guide system architecture modeling.
-
Free Online Deployment Diagram Tool: A web-based solution for creating professional deployment models instantly without software installation.
-
PlantUML Deployment Diagram Builder: A specialized integration that allows for code-based modeling and visualization using PlantUML syntax.
-
Creating Deployment Diagrams for Cloud Apps with AI: A technical guide on using AI-powered design to efficiently generate deployment diagrams for modern cloud infrastructures.
-
Beginner’s Guide to Deployment Diagrams: An introductory resource for those new to modeling system infrastructure and distribution.
-
Comprehensive Tutorial on Deployment Diagrams: An in-depth tutorial exploring the application of deployment diagrams in complex software engineering projects.