
Mastering Use-Case to UML Activity Diagrams with Visual Paradigm and VPasCode
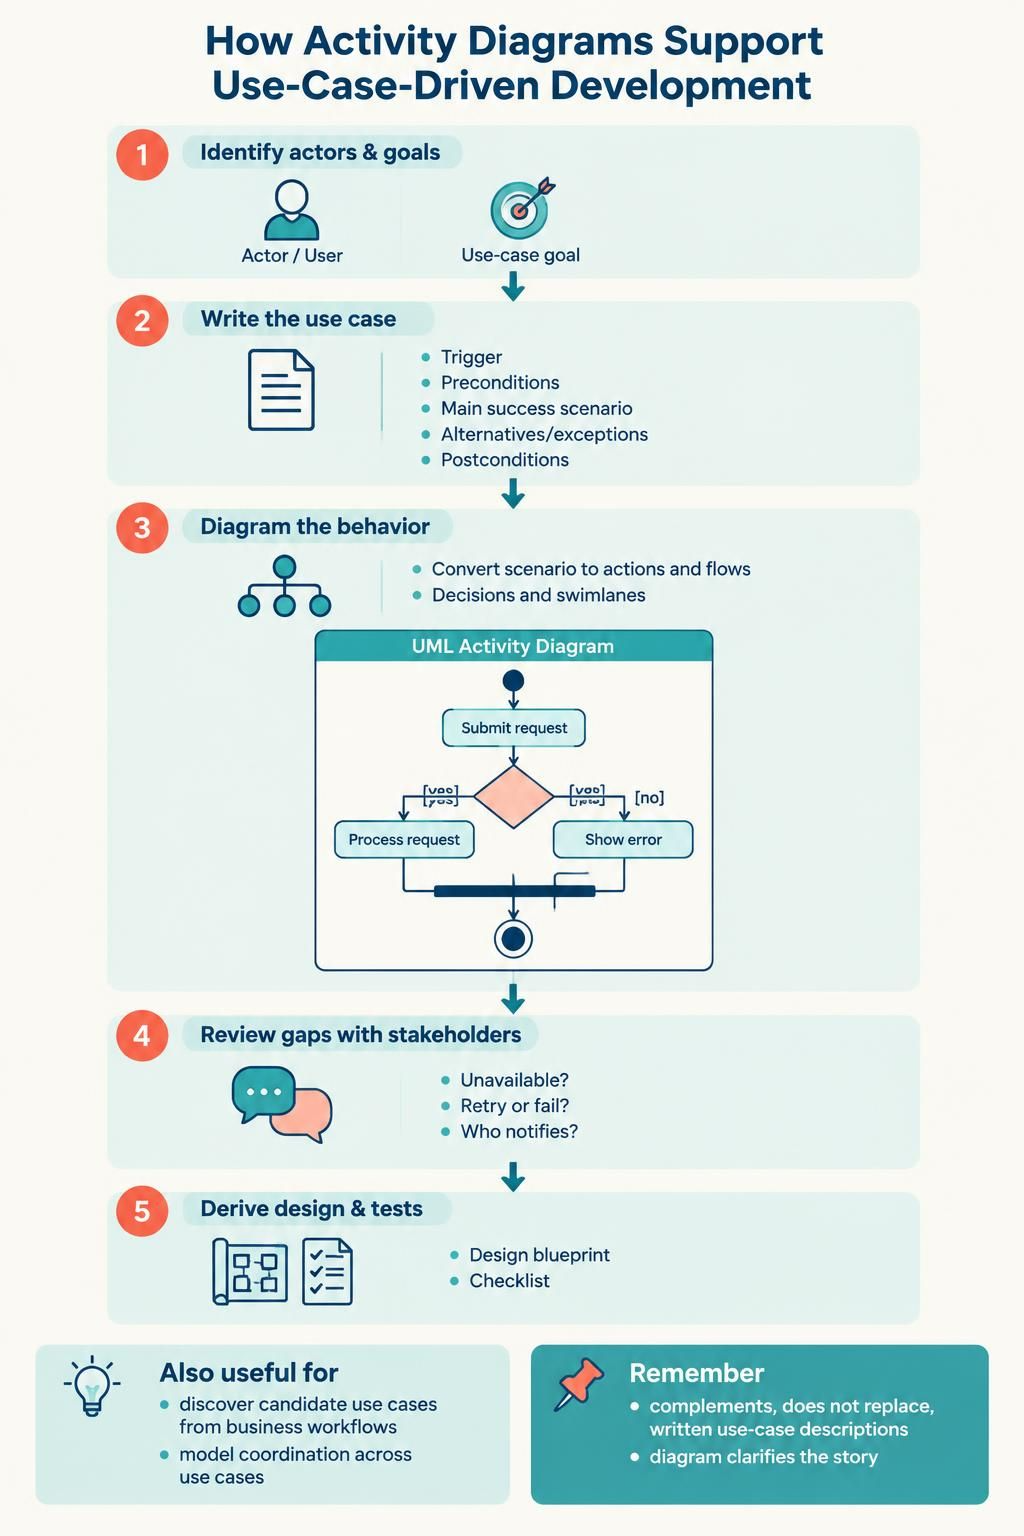
In the world of software engineering, bridging the gap between high-level business requirements and low-level technical implementation is often the most challenging part of development. This tutorial explores the systematic approach of using activity diagrams to support use-case-driven development. By following a structured workflow, teams can ensure that every user goal is not only identified but also translated into a robust, testable system behavior.
Step 1: Identifying Actors and Goals
The foundation of any successful system lies in understanding who uses it and what they want to achieve. Before drawing a single line in your modeling tool, you must clearly define the Actors (users or external systems) and their specific Goals.
- Actors: These are the entities that interact with the system. An actor could be a human user, a third-party API, or an automated scheduler.
- Goals: A goal is a specific outcome that provides value to the actor. This is distinct from a feature; a feature enables a goal, but the goal is the ultimate “why” behind the interaction.
In Visual Paradigm, this is typically initiated by creating a Use Case Diagram. This high-level view allows you to map the “who” and the “what” before diving into the “how.”
Step 2: Writing the Use Case
Once the goals are established, the next critical step is to document the Use Case. This is where the narrative of the system begins to take shape. A well-written use case description acts as the contract between stakeholders and developers.
A comprehensive use case description must include:
- Trigger: What event initiates this use case? (e.g., “User clicks ‘Place Order'”).
- Preconditions: What must be true before the process can start? (e.g., “User is logged in”).
- Main Success Scenario: The “Happy Path”—the ideal sequence of steps that leads to the goal being achieved.
- Alternatives or Exceptions: What happens if things go wrong? (e.g., “Credit card declined” or “Inventory unavailable”).
- Postconditions: What is the state of the system after the use case completes, regardless of success or failure?
Step 3: Diagramming the Behavior
This is the core transformation phase. You convert the textual scenario into a visual flow using an Activity Diagram. This diagram serves as the blueprint for the system’s logic.
From Text to Flow
When converting the use case into an activity diagram, you translate every step into an Action Node. The flow of arrows represents the control flow. It is crucial to capture the logic explicitly:
- Decision Points: These are represented by diamonds. They branch the flow based on boolean conditions (e.g., Is inventory available?).
- Swimlanes: Use swimlanes to clarify responsibility. A swimlane might represent a specific actor, a system component, or a department. This ensures that every action has a clear owner.
- Forks and Joins: Use thick bars to represent parallel processing. This is vital if multiple actions can happen simultaneously or must wait for multiple inputs to converge.
In Visual Paradigm, you can easily drag and drop these elements to construct the graph. The diagram should read like a story: “First, the user submits a request. Then, the system checks availability. If yes, process the order; if no, show an error.”
Example Logic Flow
Consider a scenario where a user submits a request. The logic might look like this:
Step 4: Reviewing Gaps with Stakeholders
One of the greatest advantages of activity diagrams is their readability. Unlike complex code or dense text, a diagram provides a “visual truth” that stakeholders can understand quickly. During the review phase, the diagram acts as a diagnostic tool.
Visualizing the flow often exposes questions that were previously overlooked:
- Unavailability: Does the diagram clearly show what happens if a database is unreachable?
- Timeouts: If a process hangs, does the flow have a timeout mechanism leading to a retry or a failure state?
- Responsibility: Are there actions where it is unclear who is responsible? (e.g., Who notifies the customer if a payment fails?)
If the stakeholders cannot explain a path in the diagram, it represents a requirement gap that must be filled before development begins.
Step 5: Deriving Design and Tests
Once the activity diagram is validated, it becomes the primary source of truth for the engineering team.
- Design Blueprint: The diagram informs the sequence of operations. Developers can derive method signatures and interaction patterns based on the flow. Swimlanes often directly map to different microservices or architectural layers.
- Test Scenarios: Every branch in the activity diagram corresponds to a test case. If you have a “Yes” path and a “No” path in your decision node, you must write a test case for both. This ensures 100% logic coverage.
Conclusion
Activity diagrams are not meant to replace use-case descriptions; rather, they complement them. While use cases provide the textual context and detailed data flow, activity diagrams provide the structural logic and control flow. By following this five-step process—Identify, Write, Diagram, Review, and Derive—you ensure that your system architecture is robust, complete, and aligned with business goals.