Introduction
In the world of software development, business analysis, and process engineering, clarity is paramount. Before a single line of code is written or a new business process is rolled out, stakeholders need to understand how a system works. This is where the Flowchart comes into play.
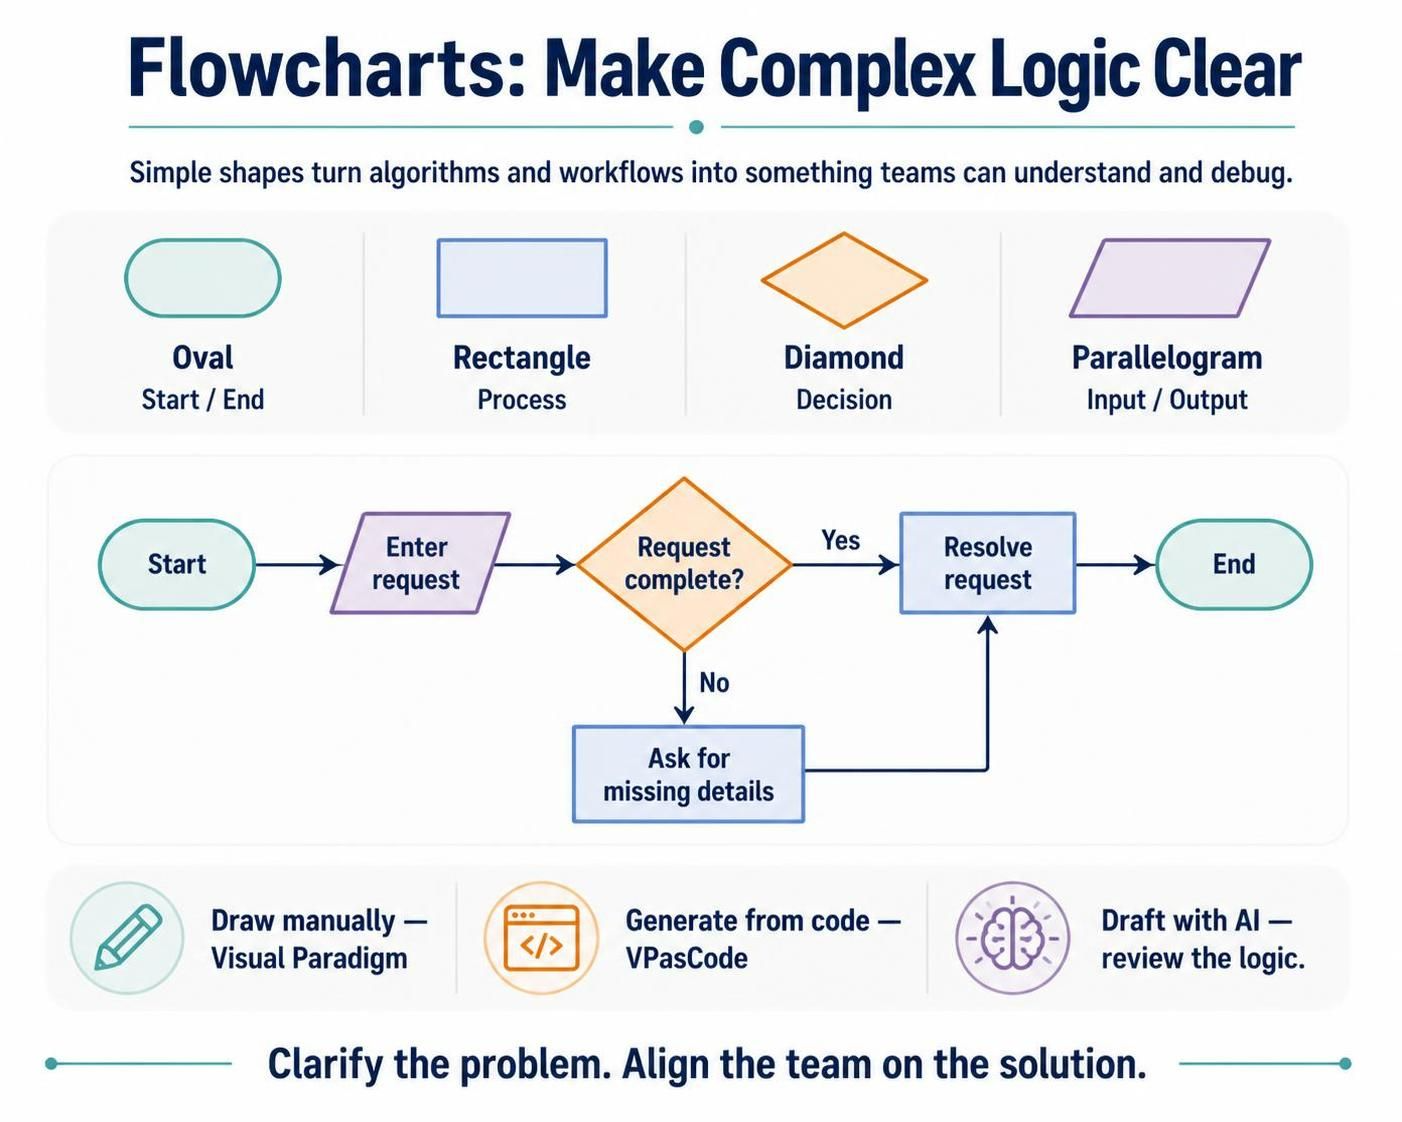
As defined in the visual guide above, a flowchart is a diagrammatic representation of an algorithm, workflow, or process. By using standardized symbols to depict steps, decisions, and inputs, flowcharts transform abstract problems into concrete, visual maps. This graphical representation is not just for developers; it is a universal language that helps teams understand complex problems, identify bottlenecks, and streamline operations.
Key Concepts: The Anatomy of a Flowchart
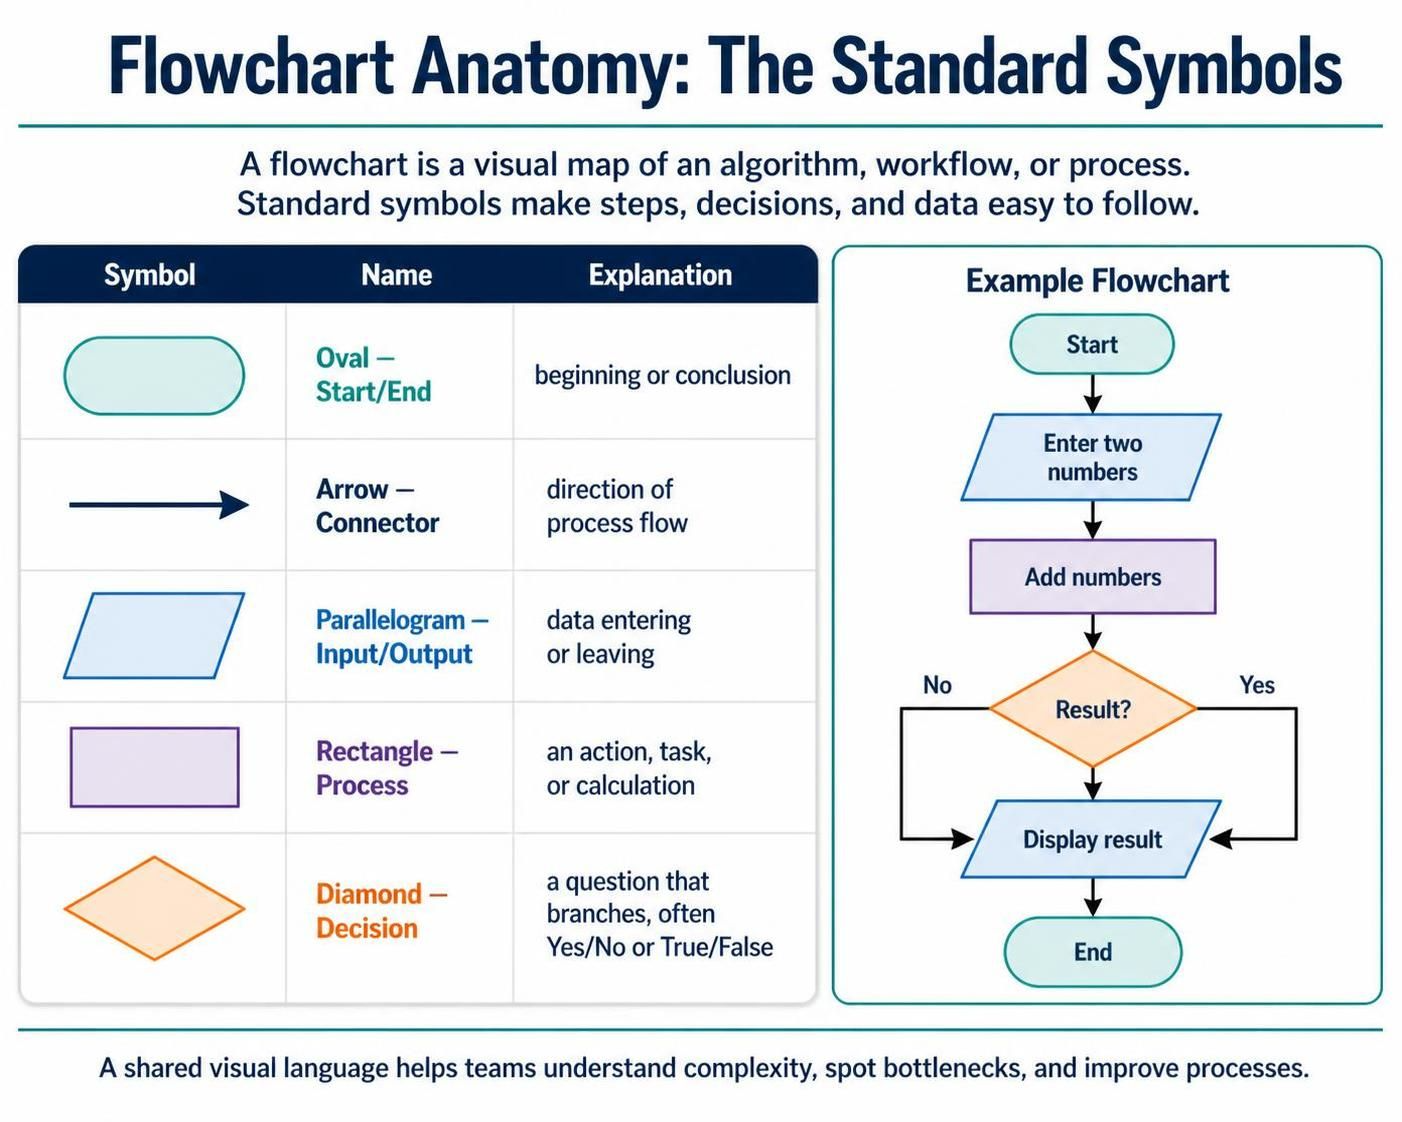
To read or create a flowchart, one must understand its vocabulary. The image below outlines the fundamental symbols used in almost every flowchart diagram:
The Standard Symbols
Based on the table in the image, here are the core components:
-
Start/End (Oval): This represents the beginning and the conclusion of the process. Every flowchart must have a clear entry and exit point.
-
Arrow (Connector): These lines dictate the “flow” of the process. They show the direction of logic from one step to the next.
-
Input/Output (Parallelogram): This shape indicates data entering the system (e.g., user input) or leaving it (e.g., displaying a result).
-
Process (Rectangle): This is the “action” step. It represents a task, operation, or calculation (e.g., “Add numbers” or “Update database”).
-
Decision (Diamond): The most critical symbol for logic. It asks a question (usually Yes/No or True/False), creating a branching path in the workflow.
Diagram Examples Using PlantUML Code
While traditional tools use drag-and-drop interfaces, modern developers often prefer “Diagram-as-Code.” Below are examples of how to create the logic described in the image using PlantUML.
Example 1: A Simple Login Process
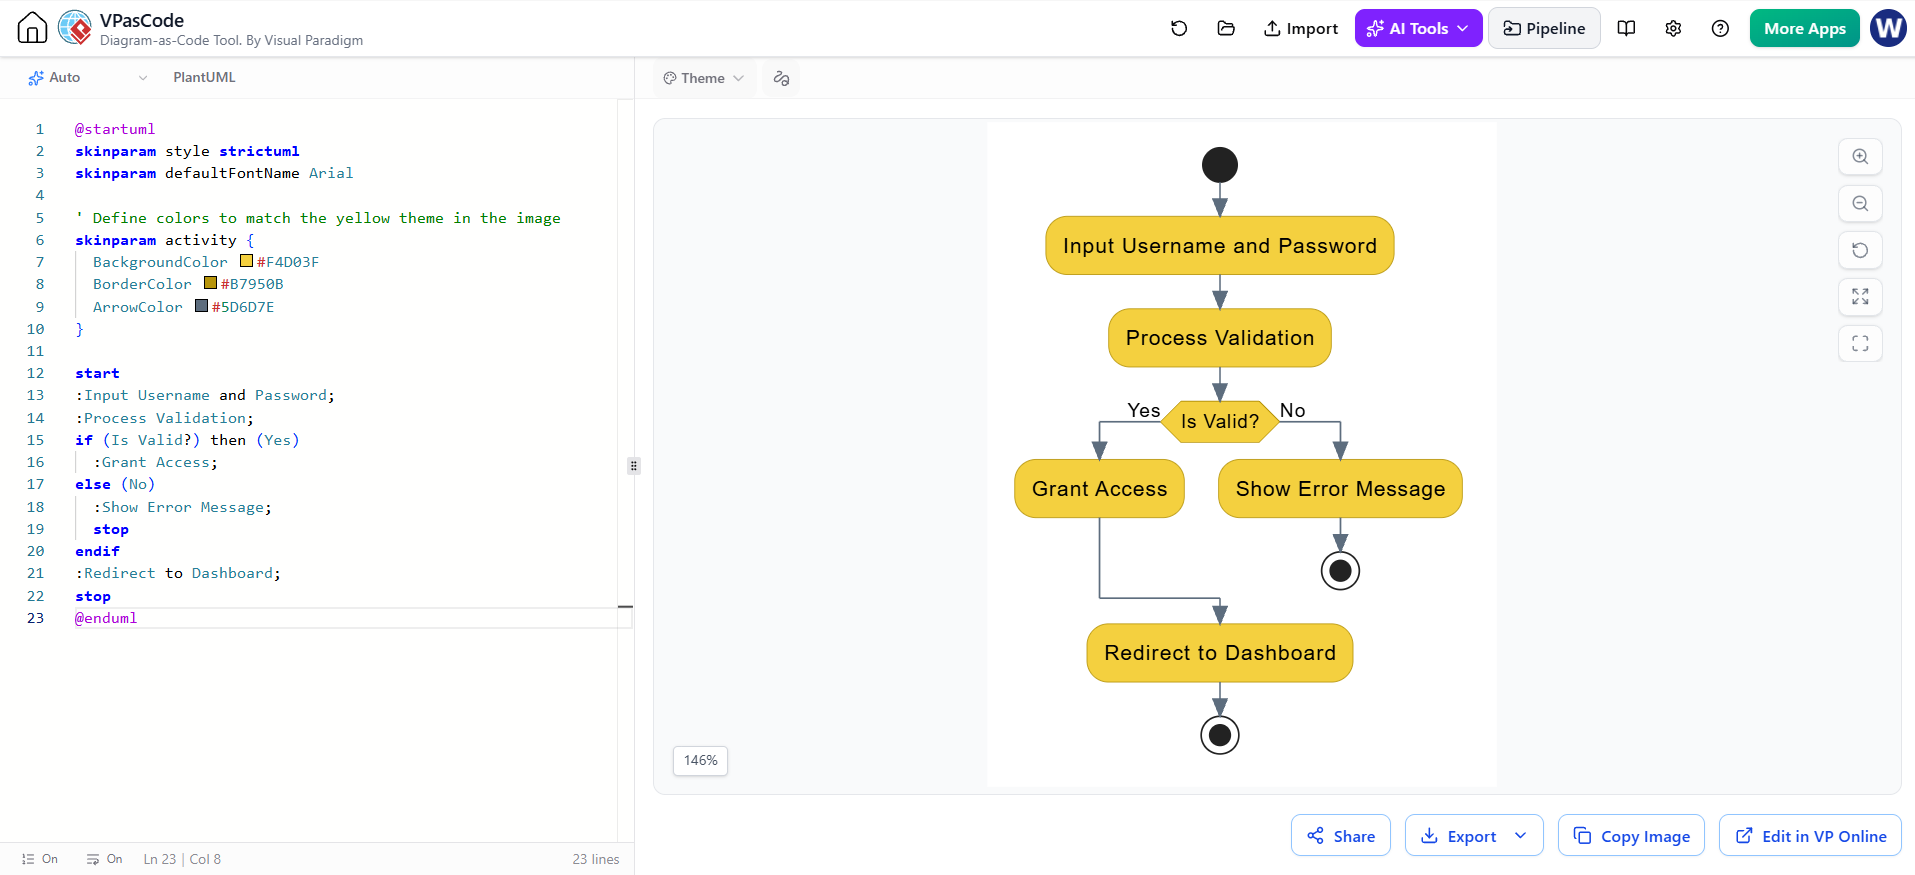
This example uses the symbols (Start, Input, Process, Decision) to map a basic login algorithm.
View Generated Flowchart in VPasCode Tool
@startuml
skinparam style strictuml
skinparam defaultFontName Arial

' Define colors to match the yellow theme in the image
skinparam activity {
  BackgroundColor #F4D03F
  BorderColor #B7950B
  ArrowColor #5D6D7E
}

start
:Input Username and Password;
:Process Validation;
if (Is Valid?) then (Yes)
  :Grant Access;
else (No)
  :Show Error Message;
  stop
endif
:Redirect to Dashboard;
stop
@enduml
How to read this:
-
Start: The circle at the top.
-
Input/Process: The rectangles handling user data.
-
Decision: The diamond
if (Is Valid?). If yes, it flows down; if no, it branches to an error and stops.
Example 2: A Manufacturing Workflow
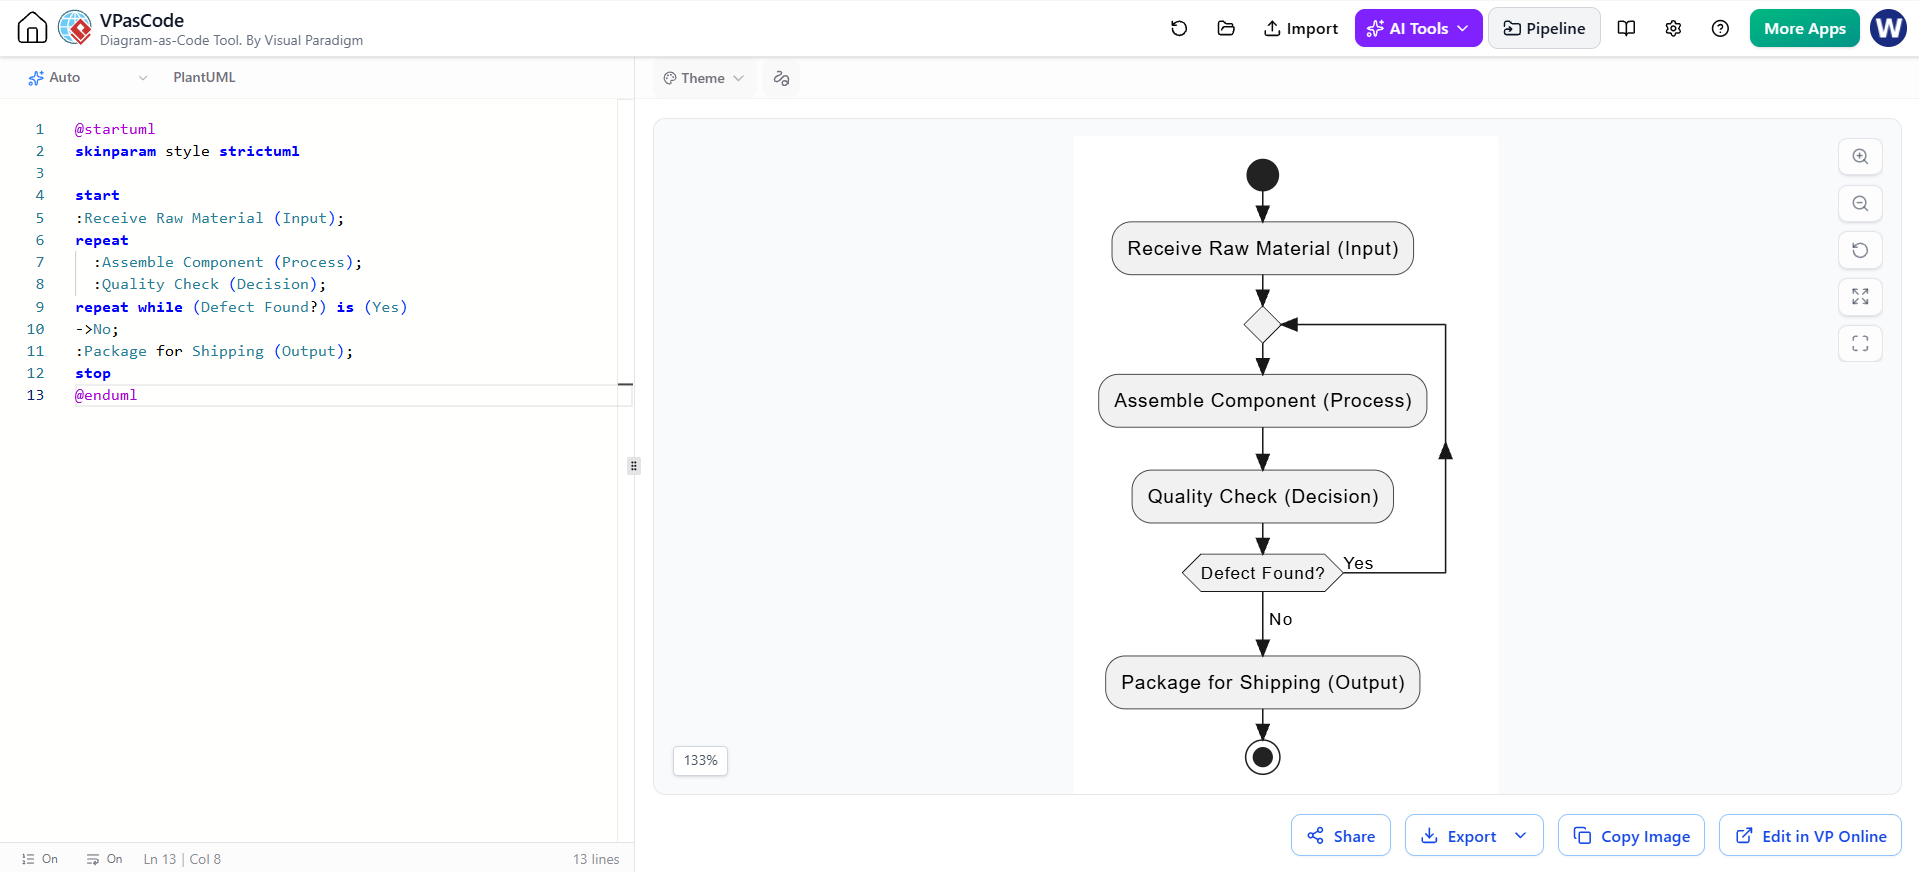
This example demonstrates a loop (repeating a process) and inputs.
@startuml
skinparam style strictuml

start
:Receive Raw Material (Input);
repeat
  :Assemble Component (Process);
  :Quality Check (Decision);
repeat while (Defect Found?) is (Yes)
->No;
:Package for Shipping (Output);
stop
@enduml
Tooling: Visual Paradigm, VPasCode, and AI
The image suggests a modern approach to diagramming. Here is how to leverage these specific tools to implement the concepts discussed:
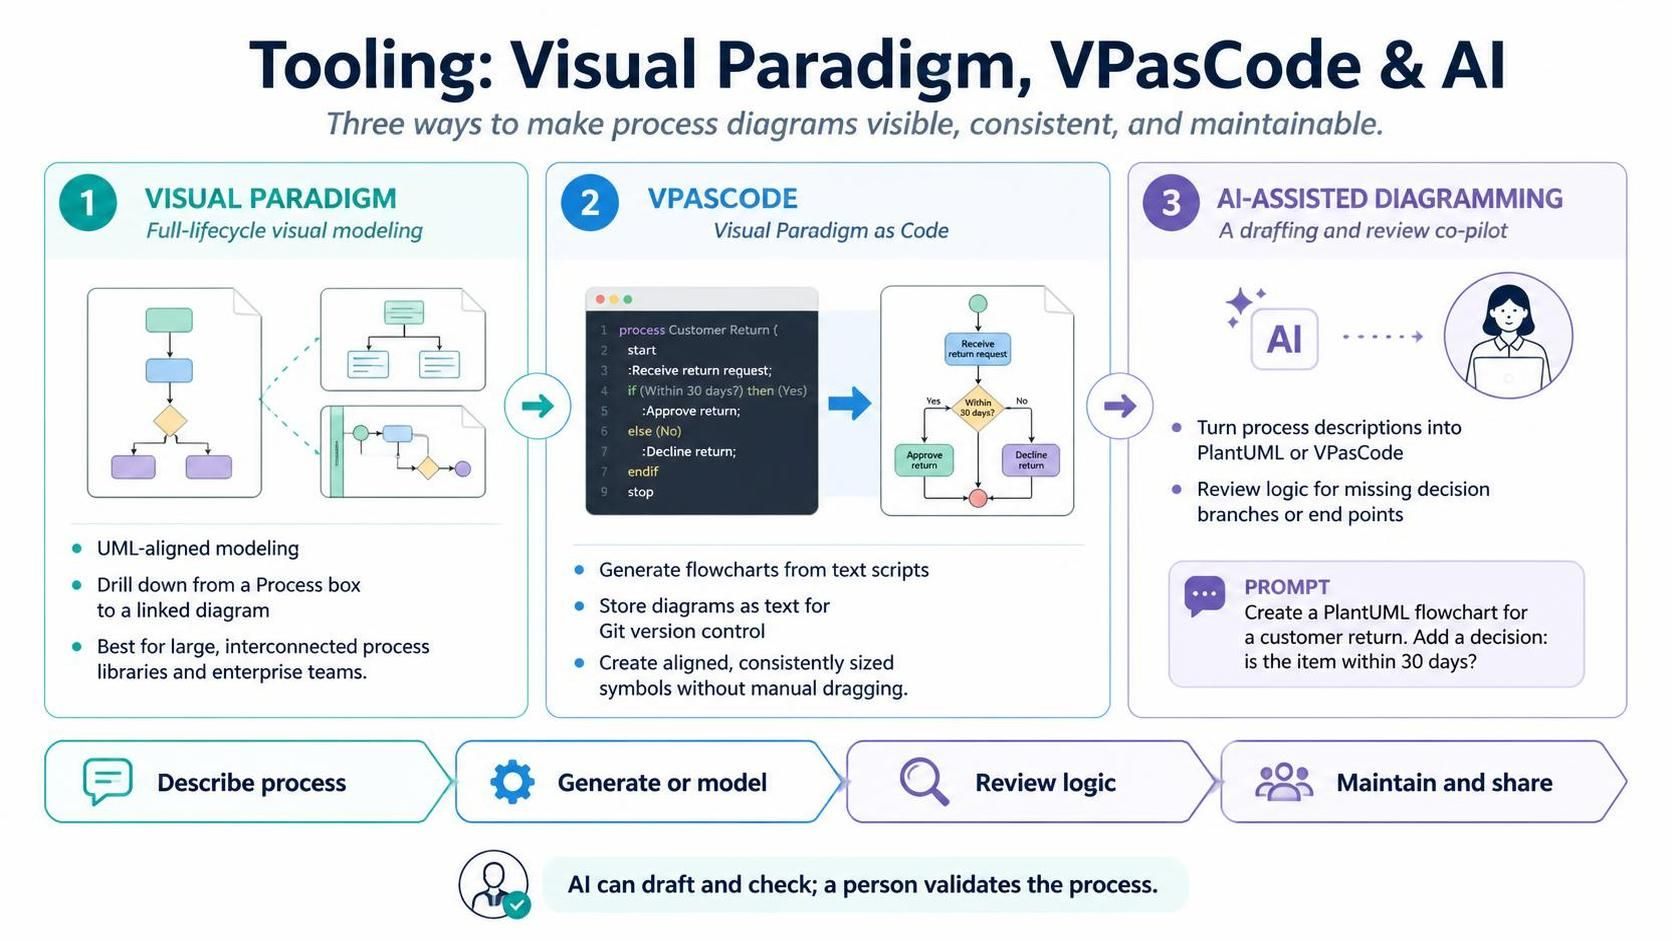
1. Visual Paradigm
Visual Paradigm is a full-lifecycle modeling tool. It is ideal for enterprise-grade flowcharts because it:
-
Ensures strict adherence to UML standards (like the symbols in the image).
-
Allows for “drill-down” capabilities, where a single “Process” box can link to a completely different diagram.
-
Best for: Business analysts and enterprise architects who need to maintain large, interconnected process libraries.
2. VPasCode (Visual Paradigm as Code)
VPasCode is a plugin that bridges the gap between visual modeling and text-based coding. It allows you to generate flowcharts automatically from text scripts. This is useful for:
-
Version Control: Storing your diagrams as text files in Git.
-
Speed: Rapidly generating diagrams without dragging shapes.
-
Consistency: Ensuring all symbols are perfectly aligned and sized automatically.
3. AI-Assisted Diagramming
Modern AI tools (like ChatGPT or Visual Paradigm’s AI features) can act as your “co-pilot” in diagram creation:
-
Text-to-Diagram: You can paste a paragraph of text describing a process, and ask the AI to generate the PlantUML or VPasCode for you.
-
Logic Checking: You can ask the AI to review your flowchart logic to see if you missed any “Decision” branches or “End” points.
-
Prompt Example: “Act as a Business Analyst. Create a PlantUML flowchart for a customer return process. Include a decision on whether the item is within 30 days.”
Conclusion
Flowcharts remain one of the most powerful tools in a problem solver’s arsenal. By mastering the simple shapes—the Oval, Rectangle, Diamond, and Parallelogram—you can map out complex algorithms and workflows that are easy to understand and debug.
Whether you choose to draw them manually using a tool like Visual Paradigm, generate them via code using VPasCode, or leverage AI to draft your logic, the goal remains the same: to create a graphical representation that clarifies a problem and aligns your team on the solution.