


System design is inherently complex. It involves orchestrating multiple components, managing data flows, and ensuring logical consistency across distributed environments. When architects and developers attempt to document these intricate processes, they often rely on text descriptions or high-level sketches that can become ambiguous over time. This is where the UML Activity Diagram becomes an indispensable asset. Far more than a simple flowchart, the Activity Diagram provides a rigorous semantic framework for modeling workflows, logic branches, and concurrency within a software system.
Understanding how to leverage this modeling technique correctly can significantly reduce miscommunication between stakeholders. It clarifies the operational logic before a single line of code is written. This guide explores the structural elements, practical applications, and strategic benefits of incorporating UML Activity Diagrams into your documentation strategy.
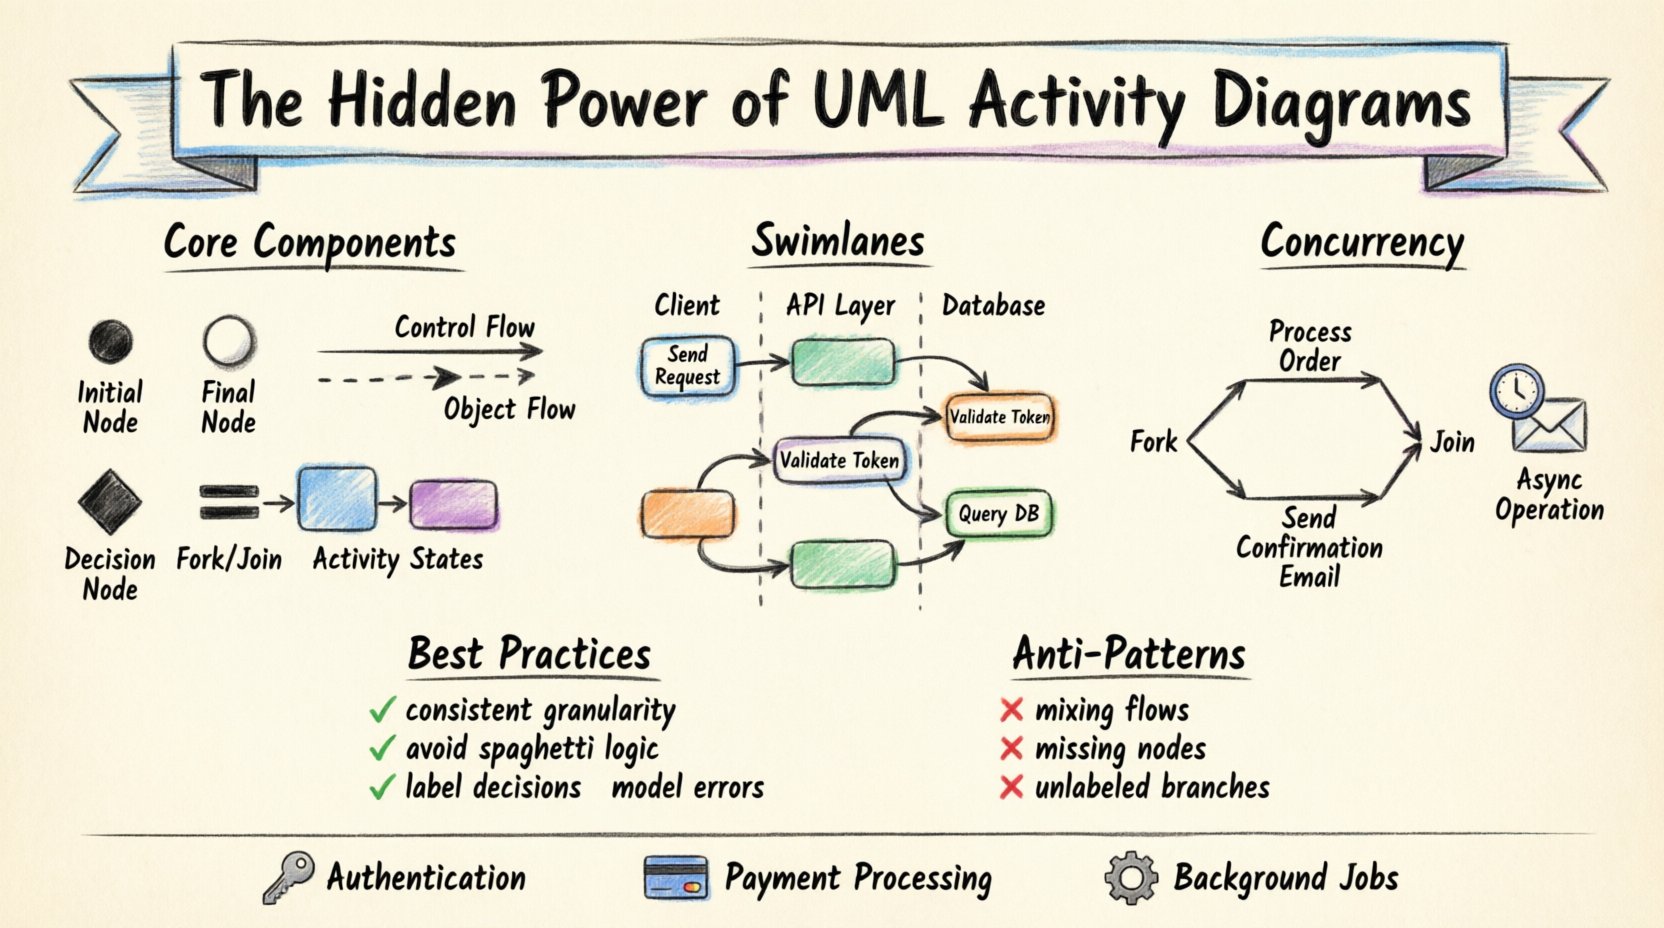
Core Components of the Activity Diagram 🧩
An Activity Diagram is a behavioral diagram that describes the dynamic nature of a system by showing the flow of control from activity to activity. To use them effectively, one must understand the specific symbols and their semantic meanings. Unlike general flowcharts, UML Activity Diagrams adhere to strict syntax rules that ensure consistency across the development lifecycle.
1. Nodes and Edges
The diagram is built from two primary building blocks:
- Nodes: These represent the individual steps, actions, or decisions within a process. They are the functional units of the workflow.
- Edges: These are the directed lines that connect nodes. They represent the flow of control or the movement of data objects between actions.
2. Control Flow vs. Object Flow
Distinguishing between these two types of flow is critical for accurate modeling:
- Control Flow: Represents the sequence of execution. It dictates when an action happens based on the completion of a previous action.
- Object Flow: Represents the movement of data or artifacts. It shows how information is created, consumed, or modified as the process moves forward.
3. Key Activity Elements
Several specific elements define the logic and structure of the diagram:
- Initial Node: A solid black circle representing the starting point of the activity. There should be only one per diagram.
- Final Node: A black circle with a border, indicating the successful completion of the activity.
- Decision Node: A diamond shape used to represent a point where the flow branches based on a condition (e.g., true/false).
- Fork and Join Nodes: Bars used to represent the splitting of the control flow into parallel threads or the synchronization of parallel threads.
- Activity State: Rounded rectangles representing a period of processing or a specific task within the system.
Modeling Concurrency and Parallelism ⚡
One of the most powerful capabilities of the Activity Diagram is its ability to model concurrency. Modern software systems rarely operate in a strictly linear fashion. Background tasks, parallel API calls, and multi-threaded processing are common requirements. The Activity Diagram handles this through specific synchronization mechanisms.
Fork and Join
When a process requires multiple actions to occur simultaneously, a Fork Node is used. This splits the control flow into two or more concurrent paths. Conversely, a Join Node waits for all incoming paths to complete before continuing. This is essential for modeling systems where:
- Multiple services must be queried before a response is returned.
- Parallel data processing is required to meet performance thresholds.
- Conditional tasks must run independently of the main thread.
Handling Asynchronous Operations
Activity Diagrams can also represent asynchronous behavior. By using activity final nodes that do not terminate the entire process, you can model long-running tasks. For example, an email notification service might trigger an immediate response to the user while a background task handles the actual email transmission. The diagram visually distinguishes between the immediate user interaction and the background processing.
Organizing Logic with Swimlanes 🏊
Complex systems involve multiple actors, departments, or system components. A single block of activity can become overwhelming to read. Swimlanes provide a mechanism to organize activities by responsibility. This visual separation helps identify handoffs and dependencies between different parts of the system.
Types of Swimlanes
Swimlanes can be defined in two primary ways:
- Partitioned by Actor: Each lane represents a specific user role or external system (e.g., “Customer”, “Payment Gateway”, “Internal Service”).
- Partitioned by Component: Each lane represents a technical layer or module (e.g., “Frontend”, “API Layer”, “Database”).
Benefits of Swimlanes
- Clarifies Ownership: It is immediately obvious which component is responsible for a specific action.
- Identifies Handoffs: Lines crossing between lanes highlight integration points, which are common sources of errors.
- Reduces Complexity: It breaks a large process into manageable vertical segments.
Integrating with Other UML Diagrams 🔄
An Activity Diagram does not exist in isolation. It works best when viewed in conjunction with other UML diagram types. This integration ensures that the dynamic behavior (Activity) aligns with the static structure (Class) and the interaction sequences (Sequence).
Relationship with Sequence Diagrams
While an Activity Diagram focuses on the flow of control and logic, a Sequence Diagram focuses on the interaction between objects over time. Use the Activity Diagram to define the overall business process, and use the Sequence Diagram to detail the specific message exchanges for each action within that process.
Relationship with Class Diagrams
The actions within an Activity Diagram often manipulate objects defined in the Class Diagram. Ensuring that the parameters and return values in the Activity Diagram match the attributes and methods in the Class Diagram maintains consistency across the design documentation.
Best Practices for Documentation 📝
Creating an Activity Diagram is straightforward, but creating a *useful* one requires discipline. Poorly constructed diagrams can be as confusing as text documentation. The following guidelines ensure clarity and utility.
1. Maintain Consistent Granularity
Do not mix high-level business steps with low-level implementation details in the same diagram. If a specific action requires a Sequence Diagram to explain, represent that action as a single node in the Activity Diagram and link it to the detailed sequence later. This keeps the high-level view readable.
2. Avoid Spaghetti Logic
Limit the number of crossing lines. If a diagram becomes too tangled, consider splitting the process into multiple sub-activities. Each sub-activity can be detailed in its own diagram, creating a hierarchical view of the system.
3. Label Decision Paths Clearly
Every edge leaving a Decision Node must have a label indicating the condition (e.g., “Valid”, “Invalid”, “Timeout”). Ambiguity here leads to different interpretations during implementation.
4. Define Error Handling
Many diagrams only show the “Happy Path”. A robust design document must account for failures. Explicitly model error nodes and recovery paths to ensure the system handles exceptions gracefully.
Common Modeling Anti-Patterns ⚠️
Even experienced architects make mistakes when documenting workflows. Being aware of common pitfalls helps maintain the integrity of the documentation.
| Anti-Pattern | Consequence | Recommended Solution |
|---|---|---|
| Mixing Control and Object Flow | Confuses the execution order with data dependency. | Use solid lines for control and dashed lines for object flow. |
| Missing Initial/Final Nodes | Leaves the process boundaries undefined. | Ensure every diagram starts with one initial node and ends with at least one final node. |
| Overuse of Swimlanes | Creates a fragmented view that is hard to follow. | Limit swimlanes to the primary actors or system layers involved. |
| Unlabeled Decision Edges | Developers must guess the branching logic. | Label every branch with a clear boolean condition or outcome. |
| Ignoring Exception Flows | Production failures occur due to unhandled edge cases. | Model error paths explicitly, linking them to error handling nodes. |
Practical Scenarios for System Design 🔧
To illustrate the value of these diagrams, consider how they apply to common system design challenges.
1. Authentication and Authorization
An Activity Diagram can map the flow from user login request to token generation. It clarifies the steps for password verification, session creation, and role checking. Swimlanes can separate the “Client” actions from the “Server” actions, making it clear where validation occurs.
2. Payment Processing
Financial transactions involve multiple external systems. A diagram can show the parallel requests to the fraud detection service and the payment gateway. It ensures that the system waits for both confirmations before marking the order as “Paid”.
3. Background Job Processing
For systems that handle data ingestion, an Activity Diagram can visualize the trigger mechanism, the queuing process, and the worker thread execution. This helps in designing scalable architectures where jobs are processed asynchronously.
Maintaining Documentation Over Time 🔄
System requirements change. Features are added, and logic is refactored. Documentation that is not maintained becomes obsolete. Activity Diagrams are particularly susceptible to drift because they represent behavior, which is often the first thing to change during iteration.
Strategies for Maintenance
- Link Diagrams to Code: Where possible, reference specific modules or functions in the documentation. This creates a traceability link.
- Review During Sprints: Include diagram updates in the Definition of Done. If the logic changes, the diagram must be updated.
- Version Control: Store diagrams in the same repository as the codebase. This ensures that diagram versions align with code releases.
Conclusion on Strategic Value 🎯
The Activity Diagram serves as a critical bridge between abstract requirements and concrete implementation. By providing a visual representation of control flow, data movement, and concurrency, it reduces the cognitive load on developers and stakeholders alike. When used with discipline and integrated with other modeling techniques, it becomes a cornerstone of effective system design documentation.
Adopting this standard practice leads to fewer misunderstandings, more robust error handling, and a clearer path from concept to deployment. It transforms the documentation from a static artifact into a living representation of the system’s logic.