Welcome to the world of software design. When you start building complex systems, text alone often fails to capture the full picture. This is where UML Activity Diagrams become your best friend. These diagrams map out workflows, logic flows, and system behaviors in a visual language that developers and stakeholders can understand together. Whether you are designing a login sequence or a payment processing pipeline, understanding this notation is essential for clear communication.
This guide breaks down everything you need to know about Activity Diagrams. We will move from basic shapes to complex concurrency models, ensuring you have the tools to document your logic effectively. No fluff, just clear, actionable knowledge.
🧩 What Is an Activity Diagram? 🧩
An Activity Diagram is a behavioral diagram that describes the flow of control and data in a system. Think of it as a flowchart but with specific rules and symbols defined by the Unified Modeling Language (UML) standard. It focuses on the sequence of actions, the conditions that trigger them, and the results they produce.
Key Characteristics
- Focuses on Logic: Unlike Use Case diagrams which focus on interactions, Activity diagrams focus on internal processes.
- Supports Concurrency: They can show multiple actions happening at the same time.
- Platform Agnostic: They do not describe code directly but describe the logic that code will implement.
- Visual Clarity: They help identify bottlenecks and decision points early in the design phase.
For a junior developer, mastering this tool means you can sketch out a solution before writing a single line of code. This reduces debugging time later and improves collaboration with designers and product managers.
🛠️ Core Elements and Notation 🛠️
Every diagram is built from specific symbols. Understanding these is the foundation. Each symbol has a strict meaning within the UML standard.
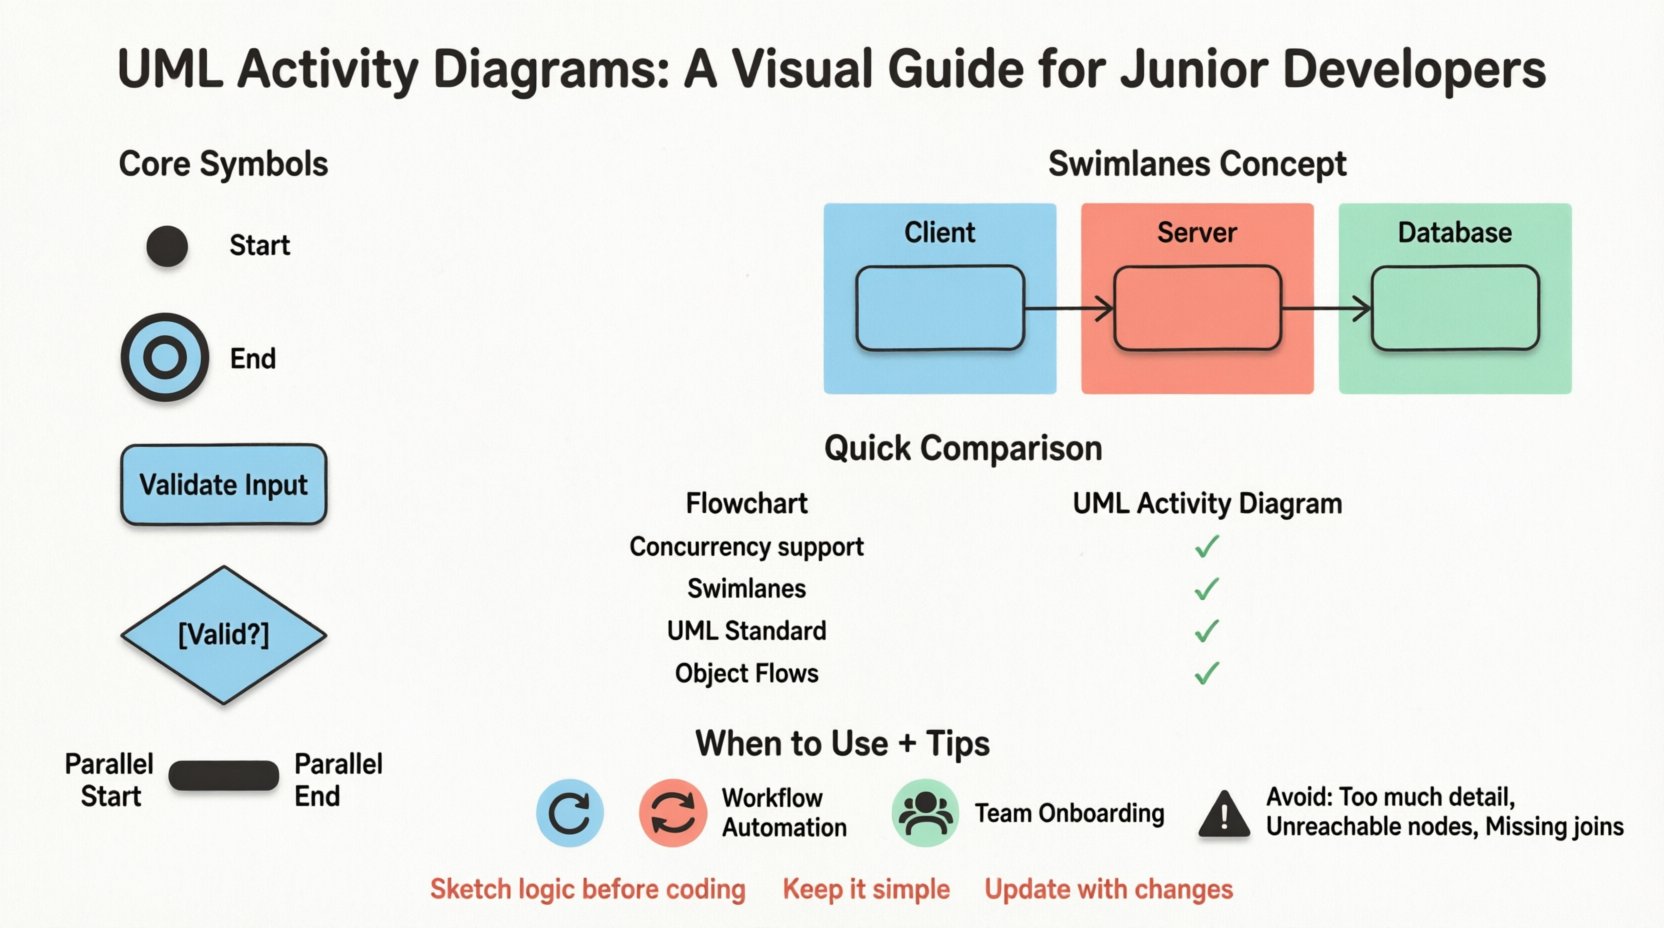
1. The Initial Node (Start)
Every flow must begin somewhere. The Initial Node is represented by a solid black circle.
- Meaning: The entry point into the activity.
- Rule: There should only be one initial node per diagram.
- Visual: ●
2. The Final Node (End)
Just as every story has an ending, every activity must terminate. The Final Node is a black circle with a border (a bullseye).
- Meaning: The successful completion of the activity.
- Rule: You can have multiple final nodes if the flow ends in different ways (success vs. failure).
- Visual: ◎
3. The Activity State (Action)
This is the work itself. Represented as a rounded rectangle, it describes a specific operation or process.
- Meaning: A functional step in the workflow (e.g., “Validate User Input”).
- Label: The text inside the box should be a verb phrase.
- Visual: [ Validate User Input ]
4. The Decision Node (Branching)
Real-world logic is rarely linear. Decisions introduce branches. The Decision Node is a diamond shape.
- Meaning: A point where the flow splits based on a condition.
- Labels: Each outgoing edge must have a guard condition (e.g., [ true ], [ false ]). Only one path is taken per execution.
- Visual: ◆
5. The Merge Node (Joining)
When multiple paths converge, they need a merge point. This is the Merge Node, also a diamond, but used differently than the decision node.
- Meaning: Combines multiple incoming flows into a single outgoing flow.
- Visual: ◆
6. The Fork and Join Nodes (Concurrency)
Complex systems often do multiple things at once. The Fork Node splits a flow into parallel threads. The Join Node waits for all parallel threads to complete before continuing.
- Fork: A thick horizontal bar. Represents splitting control.
- Join: A thick horizontal bar. Represents synchronization.
- Visual: ≡
📊 Understanding Swimlanes 📊
As systems grow, a single flow becomes messy. Swimlanes (or Partitions) organize the diagram by responsibility. They divide the diagram into horizontal or vertical areas, each assigned to a specific actor, system component, or department.
Imagine a banking app. The user action happens in one lane, the server validation in another, and the database update in a third. This clarifies who is responsible for which step.
Benefits of Swimlanes
- Clarifies Ownership: It is obvious which actor performs which action.
- Reduces Cross-References: You do not need to jump back and forth between different diagrams to understand the handoff.
- Identifies Bottlenecks: If a specific lane has too many steps, it indicates an area for optimization.
Swimlane Types
| Type | Description | Best Use Case |
|---|---|---|
| Vertical Swimlanes | Divides the diagram vertically into columns. | Organizing by system component (e.g., Frontend, Backend). |
| Horizontal Swimlanes | Divides the diagram horizontally into rows. | Organizing by user role (e.g., Admin, Guest). |
| No Swimlanes | Single flow without partitions. | Simple, single-threaded logic flows. |
⚙️ Advanced Concepts: Concurrency and Data 🚀
Junior developers often struggle with representing parallel processes. This is the most advanced part of Activity Diagrams.
1. Object Flows
Activity diagrams are not just about control; they are about data moving between activities. An Object Flow connects an object node (rectangle with a small triangle) to an activity.
- Input: Data required to start an action.
- Output: Data produced by the action.
- Example: An activity “Calculate Tax” requires an “Invoice” object and produces a “TaxAmount” object.
2. Exception Handling
Software crashes or errors happen. You can model exceptions using Exception Handler clauses within an activity.
- Try Block: The normal flow of actions.
- Except Block: If an error occurs in the try block, control jumps here.
- Finally Block: Cleanup actions that run regardless of success or failure.
🆚 Activity Diagram vs. Flowchart 🆚
People often confuse Activity Diagrams with standard flowcharts. While they look similar, there are technical differences.
| Feature | Flowchart | UML Activity Diagram |
|---|---|---|
| Standard | Informal / Varies | Strict UML Standard |
| Concurrency | Hard to represent | Native support (Fork/Join) |
| Swimlanes | Optional | Standard feature (Partitions) |
| Focus | Algorithmic logic | System behavior & Workflow |
| State | Usually ignores state | Can represent object states |
For professional software engineering, the Activity Diagram is preferred because it handles concurrency and object flows natively.
📝 When to Use Activity Diagrams 📝
Not every problem needs a diagram. Knowing when to apply this tool saves time. Use Activity Diagrams in these scenarios:
1. Complex Business Logic
When a feature involves many conditional branches (if/else statements) or loops, a diagram helps you visualize the paths.
2. Workflow Automation
For processes involving multiple systems (e.g., Order Placed → Inventory Check → Payment Gateway → Email Send), swimlanes are critical.
3. Onboarding and Training
Junior developers can use these diagrams to understand the expected flow of a legacy system without reading thousands of lines of code.
4. Code Review Preparation
Before reviewing code, sketch the intended logic. If the code deviates from the diagram, you have found a potential bug.
🚫 Common Pitfalls to Avoid 🚫
Even experienced engineers make mistakes. Here are the most common errors junior developers encounter.
1. Too Much Detail
An Activity Diagram should not show every line of code. It should show the logical steps. If you try to draw every variable assignment, the diagram becomes unreadable.
2. Unreachable Nodes
Ensure every node is reachable from the Initial Node. Dead ends confuse readers and suggest broken logic.
3. Ignoring the Join
When you use a Fork (split), you must eventually use a Join (merge). If you split a flow but never join it, the diagram implies the system hangs or continues with undefined state.
4. Ambiguous Decision Guards
Every outgoing line from a Decision Node must have a label. Avoid blank lines. If a condition is complex, describe it clearly (e.g., [ User Has Admin Role ] instead of just [ Yes ]).
5. Mixing Control and Data
Do not confuse the flow of logic with the flow of data. Use arrows for control flow and lines with object shapes for data flow. Mixing them creates confusion about what is happening versus what is being passed.
💡 Step-by-Step Example: User Login 🚦
Let’s walk through a practical example. We will design the logic for a secure login process using swimlanes to separate the Client, the Server, and the Database.
1. Define the Actors
- Client: The user interface (Mobile App or Web Browser).
- Server: The application logic.
- Database: The storage layer.
2. The Initial Flow
- Client: User enters credentials.
- Client: Sends request to Server.
- Server: Validates input format.
- Server: Queries Database for user record.
3. The Decision Logic
- Decision: Is user found in Database?
- Yes: Hash the provided password and compare with stored hash.
- No: Return “Invalid Credentials”.
4. The Outcome
- Match: Generate Session Token. Return Success.
- No Match: Return “Incorrect Password”.
- Failure: Log the attempt. Return Error.
By mapping this out, you can see exactly where the security checks happen and where the data travels. You might notice that checking the user existence and checking the password are sequential steps that could be optimized or batched in a real-world implementation.
🔗 Integration with Other UML Diagrams 🔗
Activity Diagrams do not exist in a vacuum. They work best when combined with other UML diagrams.
1. Sequence Diagrams
Sequence diagrams show the timeline of messages between objects. Activity diagrams show the logic flow. You can use an Activity Diagram to define the high-level flow, then use Sequence Diagrams to detail the object interactions within a specific activity.
2. Class Diagrams
Class diagrams define the structure. Activity diagrams define the behavior. The inputs and outputs in your Activity Diagram often correspond to the attributes and methods in your Class Diagram.
3. State Machine Diagrams
State diagrams focus on the state of a single object. Activity diagrams focus on the workflow of a process. They complement each other; a process (Activity) might trigger a state change (State Machine) in an object.
🛡️ Best Practices for Documentation 🛡️
To create diagrams that stand the test of time, follow these guidelines.
- Consistent Naming: Use the same terms for activities throughout the diagram. Do not switch between “Login” and “Sign In”.
- White Space: Allow space between elements. Crowded diagrams are hard to read.
- Directional Flow: Ensure the flow generally moves from Top to Bottom or Left to Right. Avoid crossing lines excessively.
- Version Control: Treat your diagrams like code. Update them when the logic changes. Outdated diagrams are worse than no diagrams.
- Modularize: If a diagram is too large, break it down. Use a “Call Behavior” action to link to a sub-diagram.
🎓 Conclusion for the Aspiring Engineer 🎓
Learning to draw an Activity Diagram is a skill that pays dividends throughout your career. It forces you to think logically before you code. It helps you communicate complex ideas without ambiguity.
Remember, the goal is not to create a perfect picture immediately. It is to create a map that guides you and your team through the complexity of software development. Start simple. Master the basic nodes. Add swimlanes when the system grows. Incorporate concurrency only when necessary.
Keep practicing. Sketch your features on paper first. Then move to digital tools. Over time, the symbols will become second nature, and you will find that your code is cleaner, your logic is sounder, and your collaboration is smoother. This visual discipline is a hallmark of a senior engineer, and starting now puts you ahead of the curve.