Concurrency in modern software systems introduces significant complexity. When multiple threads or processes attempt to access shared resources simultaneously, the system becomes vulnerable to race conditions. These defects often manifest unpredictably, making them difficult to reproduce and debug. To address this, visual modeling techniques become essential tools for architects and developers. Specifically, UML activity diagrams offer a structured way to map control flow and identify synchronization points before code is written.
This guide explores a practical scenario where race conditions were identified and resolved using UML activity diagram logic. We will walk through the modeling process, the analysis of concurrency risks, and the implementation of synchronization primitives based on the visual model. The focus remains on architectural clarity and logical consistency rather than specific programming languages or tools.
Understanding Concurrency Risks ⚠️
Before diving into the case study, it is necessary to define the core problem. A race condition occurs when the outcome of a process depends on the sequence or timing of other uncontrollable events. In the context of activity diagrams, this often translates to parallel paths interacting with a shared state without proper coordination.
Common Types of Race Conditions
- Data Race: Two or more actions access the same data, and at least one is a write operation, without synchronization.
- Logical Race: The order of operations matters, but the execution flow allows for invalid permutations.
- Resource Contention: Multiple threads compete for a limited resource, leading to starvation or deadlock.
Identifying these issues in code is often a reactive process. Detecting them in a model is proactive. By visualizing the flow, architects can spot where multiple threads might converge on a shared node without a clear handshake mechanism.
The Role of UML Activity Diagrams 📊
UML activity diagrams are particularly suited for modeling concurrency because they support control flow objects that represent parallel execution. Key elements include:
- Fork Nodes: Represent the splitting of a single flow into multiple concurrent threads.
- Join Nodes: Represent the synchronization point where concurrent threads converge.
- Control Flow: Defines the sequence of activities.
- Object Flows: Show the movement of data between nodes.
When modeling a system, these nodes act as the blueprint for thread management. If a fork creates two paths that both write to the same object before a join node occurs, a race condition is likely present in the design.
Case Study Context: Distributed Transaction Processing 🔄
Consider a generic order processing system. This system handles incoming requests, validates data, updates inventory, and records financial transactions. The architecture relies on parallel processing to maintain low latency. Multiple workers handle different stages of the order lifecycle simultaneously.
System Requirements
- High throughput for order ingestion.
- Strict consistency for inventory levels.
- Atomicity for financial records.
- Real-time status updates for the user interface.
The initial design assumed that parallel threads would not conflict. However, during load testing, inventory counts occasionally dropped below zero, and financial records showed duplicate charges. The root cause was a race condition in the inventory update logic.
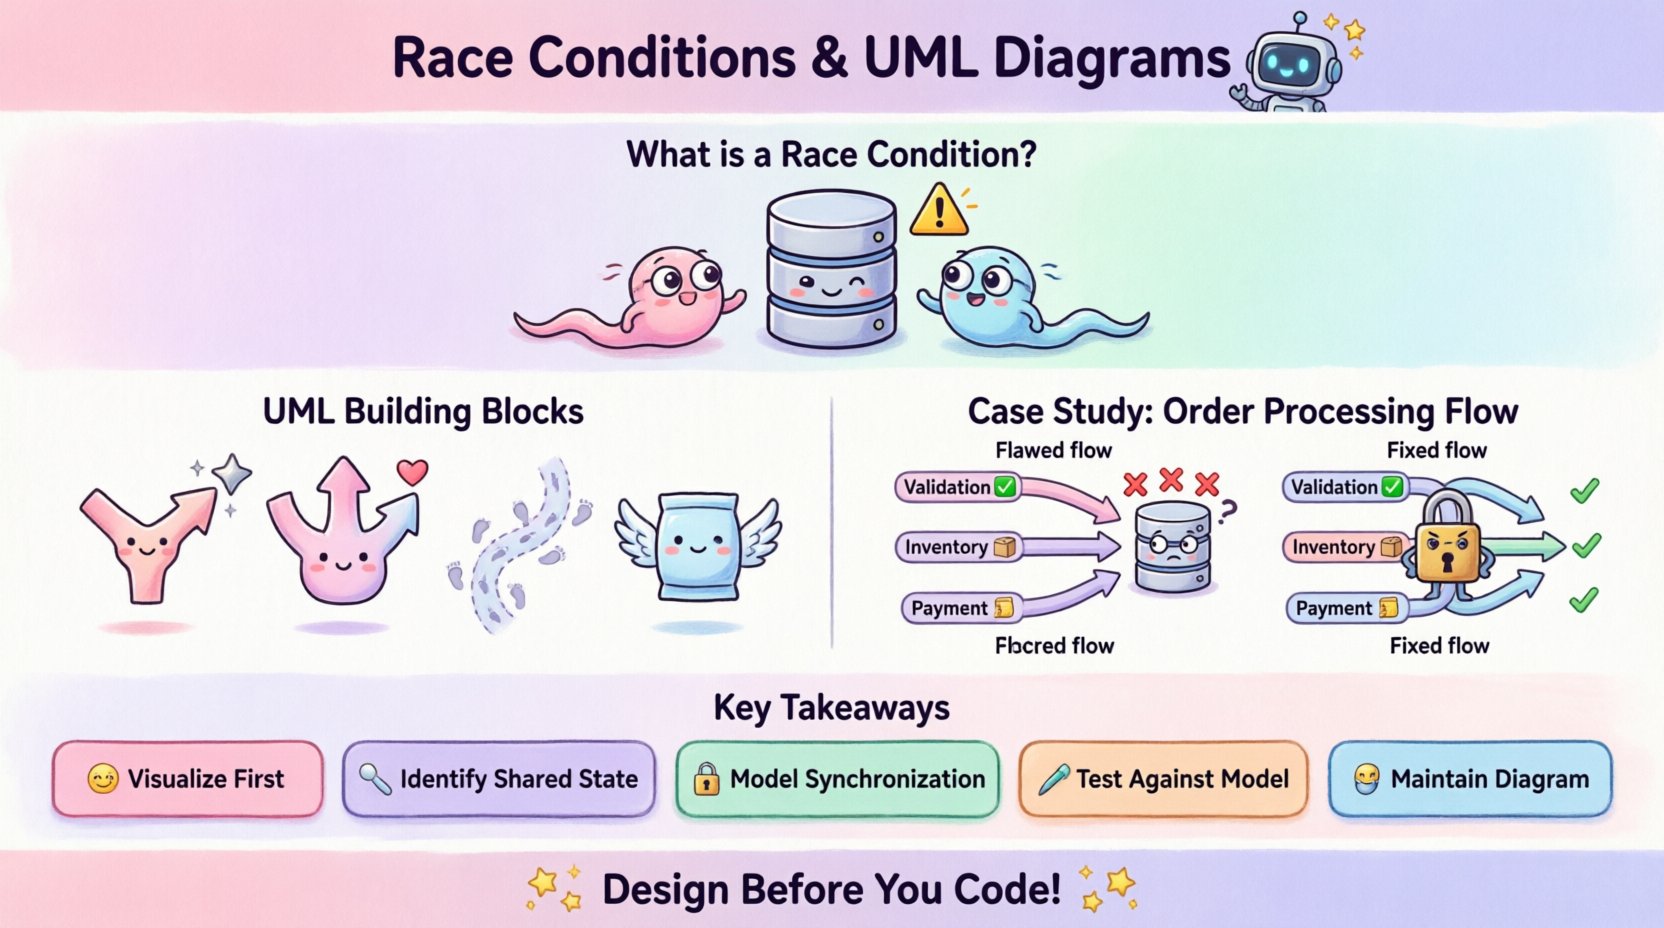
Initial Model: The Flawed Flow 🧩
The first step in resolution was to map the existing logic into a UML activity diagram. The goal was to visualize the control flow from the moment an order is received to the moment it is confirmed.
Diagram Elements Identified
- Start Node: Order receipt.
- Fork Node: Split into Validation, Inventory Check, and Payment Processing.
- Parallel Activities: Each branch runs independently.
- Join Node: All branches must complete before confirmation.
Upon reviewing the diagram, the following issue emerged. The Inventory Check branch reads the current stock level. Simultaneously, the Payment Processing branch might trigger a reservation of that stock. If both threads read the stock as 10, and both attempt to reserve, the final count could be incorrect.
Visualizing the Conflict
| Activity Branch | Operation | Shared Resource | Timing Risk |
|---|---|---|---|
| Inventory Check | Read Stock Level | Database Row | High (Before Write) |
| Payment Processing | Reserve Stock | Database Row | High (Concurrent Write) |
| Order Fulfillment | Update Status | Log Entry | Medium (Append Only) |
The table highlights where the shared resource is accessed. The critical vulnerability lies in the Inventory Check and Payment Processing branches interacting with the same database row without mutual exclusion.
Refining the Logic: Synchronization Patterns 🛠️
To resolve the race condition, the activity diagram was revised to include explicit synchronization mechanisms. The goal was to ensure that the inventory update happened atomically with the payment confirmation.
Implementing Guard Conditions
Guard conditions in activity diagrams allow us to specify logical requirements for transitions. We introduced a guard condition to the Payment Processing branch. This condition ensures that the stock reservation only proceeds if the inventory check confirms availability.
- Condition:
if (currentStock > 0) - Effect: Prevents the reservation thread from proceeding if stock is insufficient.
- Limitation: This alone does not prevent a race if the stock changes between the check and the write.
Introducing Mutex Semantics
To guarantee safety, the diagram was updated to reflect a mutex lock. In the context of the diagram, this is represented by a specific activity node labeled Lock Inventory. This node acts as a barrier.
The revised flow looks like this:
- Order Received.
- Split into Validation and Payment.
- Payment branch enters Lock Inventory activity.
- While locked, the system performs the check and the update.
- Lock is released after the update completes.
- Validation branch waits for the lock or proceeds independently if no inventory change is needed.
Visual Representation Changes
The fork node was adjusted. Instead of a free-flowing split, the join node now requires a specific synchronization signal. This signal indicates that the critical section (inventory update) has completed safely.
Identifying the Race Condition in the Diagram 🔍
Using the revised model, we can explicitly identify where the race condition existed and how the fix alters the flow.
Problematic Pattern
- Two parallel paths access a shared data node.
- No join node exists between the access points.
- The order of execution is non-deterministic.
Resolved Pattern
- One path is serialized via a lock node.
- Other paths wait or are bypassed until the lock is released.
- A join node ensures all critical updates are finalized before proceeding.
This visual distinction makes the concurrency strategy clear to stakeholders. It moves the discussion from abstract code to concrete flow logic.
Validation and Testing Strategies 🧪
Once the diagram was updated, the testing strategy was aligned with the model. The activity diagram serves as the source of truth for test cases.
Model-Based Testing
Testers use the diagram to generate scenarios that exercise the parallel paths. Specific attention is paid to the Lock Inventory node.
- Stress Testing: Run multiple threads attempting to access the inventory node simultaneously.
- Timeout Testing: Verify that if the lock is held too long, the system does not deadlock.
- Failure Injection: Simulate a crash during the lock operation to ensure the lock is released.
Traceability Matrix
A traceability matrix links each activity node in the diagram to a specific test case. This ensures that every synchronization point is verified.
| Diagram Node | Test Scenario | Expected Outcome | Status |
|---|---|---|---|
| Fork Node | Parallel Ingestion | Both threads start simultaneously | Pass |
| Lock Inventory | Concurrent Access | Only one thread holds lock | Pass |
| Join Node | Finalization | Order confirmed only after all checks | Pass |
Maintenance and Evolution 📈
Software systems evolve. New features are added, and requirements change. The activity diagram must be maintained to reflect these changes. If the synchronization logic changes, the diagram should be updated first.
Change Management Process
- Impact Analysis: When adding a new feature, check if it introduces new shared resources.
- Diagram Update: Modify the UML diagram to show the new flow and synchronization points.
- Code Review: Reviewers check the code against the diagram to ensure implementation matches the model.
This process prevents technical debt related to concurrency. Developers often optimize for speed and forget to update synchronization logic. A visual model acts as a reminder.
Documentation Benefits
The diagram serves as living documentation. It explains how the system handles concurrency without requiring developers to read complex code comments.
- New team members can understand the flow quickly.
- Auditors can verify compliance with data integrity standards.
- Architects can spot bottlenecks in the control flow.
Common Pitfalls in Modeling Concurrency 🚫
While UML activity diagrams are powerful, they are not immune to misuse. There are common mistakes that can lead to further confusion or unresolved issues.
Over-Simplification
Modeling every single line of code is unnecessary and creates clutter. Focus on the control flow and data flow at the architectural level.
Ignoring Deadlocks
A join node does not guarantee a deadlock-free system. If two threads wait for each other to release a lock, the system hangs. The diagram should indicate potential wait states.
Missing Object Flows
Control flow shows execution order, but object flow shows data movement. Missing object flows can hide data dependencies that cause races.
Assuming Sequential Execution
Just because activities are drawn sequentially does not mean they execute sequentially. The diagram must explicitly show forks and joins to indicate parallelism.
Summary of Key Takeaways ✅
Resolving race conditions requires a shift from debugging to designing. By using UML activity diagrams, teams can visualize concurrency risks before they become production issues.
- Visualize First: Map the flow to identify parallel paths.
- Identify Shared State: Look for nodes where multiple threads access the same data.
- Model Synchronization: Use fork and join nodes to represent locks and barriers.
- Test Against the Model: Ensure the implementation matches the diagram.
- Maintain the Diagram: Keep the model updated as the system evolves.
The case study demonstrated that a clear model can expose hidden race conditions in inventory management systems. By introducing a lock node in the activity diagram, the team ensured that inventory updates were atomic and consistent.
Final Thoughts on System Integrity 🌟
Building reliable concurrent systems is a discipline that blends logic, modeling, and testing. The activity diagram provides the structure needed to organize these efforts. It transforms abstract concurrency concepts into concrete visual representations.
When architects prioritize the logic of the flow, they reduce the likelihood of race conditions. This approach leads to systems that are not only functional but also predictable and maintainable. The investment in modeling pays off during the maintenance phase, where understanding the original design intent is crucial.
For teams looking to improve their concurrency handling, starting with the model is the most effective first step. It sets the foundation for robust code and stable operations.