Designing complex software systems requires more than just writing code. It demands a clear vision of how data moves, how users interact, and how services communicate behind the scenes. One of the most effective tools for visualizing this movement is the UML Activity Diagram. In this guide, we explore a real-world scenario where a full-stack workflow is mapped out to ensure clarity, efficiency, and maintainability. 🛠️
Many development teams struggle with communication gaps between frontend engineers, backend architects, and database administrators. Without a shared visual language, assumptions lead to bugs and delays. By mapping workflows early, teams can identify bottlenecks, define error handling strategies, and document system behavior before a single line of code is committed. This article breaks down a comprehensive case study, demonstrating how to translate abstract requirements into concrete, actionable diagrams. 📝
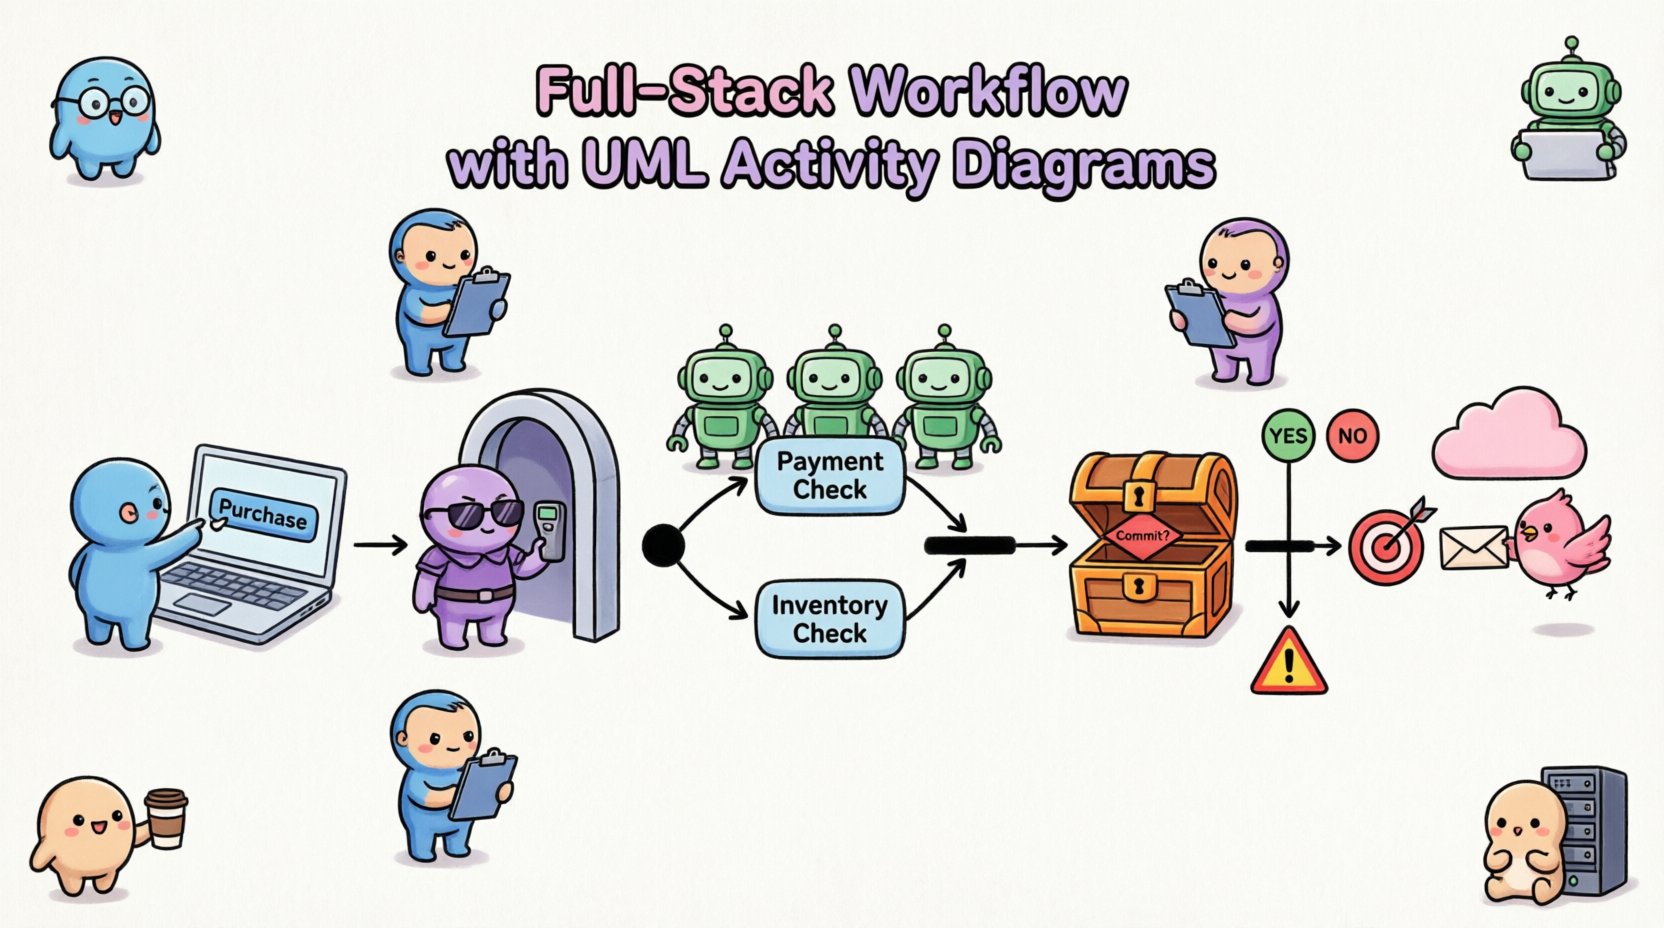
🎯 The Scenario: High-Volume Transaction System
To illustrate the power of activity diagrams, we will examine a hypothetical scenario involving a high-volume transaction system. Imagine a platform where users purchase digital goods. The system must handle user authentication, inventory checks, payment processing, and notification delivery. This is a typical full-stack workflow involving multiple layers of abstraction. 🌐
The goal is to document the entire flow from the moment a user clicks a button until the confirmation email is sent. This requires mapping:
- Client-Side Logic: Input validation and state management.
- Network Layer: API requests, routing, and authentication tokens.
- Server-Side Logic: Business rules and orchestration.
- Data Layer: Database transactions and consistency checks.
- External Dependencies: Third-party payment gateways and email services.
By visualizing these interactions, we create a single source of truth that stakeholders can review. This reduces ambiguity and aligns expectations across the engineering team. 👥
🧩 Understanding Activity Diagram Symbols in Context
Before diving into the workflow, it is essential to understand the symbols used in activity diagrams. These symbols represent the flow of control within the system. Using standard notation ensures that any developer, regardless of their specific tech stack, can interpret the diagram. 🔍
| Symbol | Name | Function in Workflow |
|---|---|---|
| ⚫ | Initial Node | Starts the workflow; entry point. |
| ⬜ | Activity / Action Node | Represents a specific task or processing step. |
| ⬠ | Decision Node | Branches the flow based on a condition (Yes/No). |
| ⬛ | Fork Node | Splits the flow into parallel concurrent activities. |
| ⬛ | Join Node | Merges parallel flows back into a single flow. |
| 🔴 | Final Node | Ends the workflow successfully. |
| ⚠️ | Exception Flow | Indicates error handling paths outside the main flow. |
Understanding these symbols allows us to construct complex logic without writing verbose text descriptions. Each node represents a logical checkpoint in the system’s lifecycle. 🔄
🖥️ Phase 1: Frontend Interaction and Input Validation
The workflow begins on the client side. This is where the user experience is defined. The activity diagram must capture not just the happy path, but also how the system reacts to invalid inputs. This phase is critical because it determines the quality of data entering the backend. 📉
Key Steps in Frontend Mapping:
- User Action: The user initiates a purchase. This is represented by the initial node in the diagram.
- Client-Side Validation: Before sending data, the application checks for required fields, email formats, and credit card lengths. This prevents unnecessary network traffic.
- State Submission: Valid data is packaged into a request payload.
- Loading State: The interface indicates processing to prevent duplicate submissions.
In the activity diagram, these steps appear as a sequence of action nodes. A decision node follows validation to determine if the data is acceptable. If the validation fails, the flow branches to an error handling activity, prompting the user to correct the information. This visual separation helps developers implement robust validation logic without cluttering the main success path. 🛡️
It is important to note that the frontend diagram should not include backend details. Keeping the scope focused ensures that the diagram remains readable. Backend dependencies are represented as dashed lines or external entities to indicate a request is made, not the internal processing of that request. 🔗
🚦 Phase 2: API Gateway and Middleware
Once the request leaves the client, it enters the network layer. This phase involves the API Gateway, authentication middleware, and rate limiting. These components act as the gatekeepers of the system, ensuring security and stability. 🔐
Mapping the Gateway Flow:
- Request Reception: The gateway receives the HTTP request.
- Authentication Check: The system verifies the API token or session cookie.
- Rate Limiting: The system checks if the user has exceeded their request quota.
- Request Routing: The request is forwarded to the appropriate service.
In the activity diagram, the Authentication Check is a critical decision node. If the token is invalid, the flow immediately routes to an error response activity. This is often visualized as a separate swimlane or a distinct branch to highlight security failures. ⚠️
| Middleware Component | Activity Node Label | Condition for Failure |
|---|---|---|
| Authentication | Validate Token | Token Expired or Invalid Signature |
| Rate Limiter | Check Quota | Requests > Limit Threshold |
| Input Sanitization | Sanitize Payload | Malicious Input Detected |
By mapping these middleware steps, teams can ensure that security policies are enforced consistently across all entry points. This also helps in debugging, as logs can be correlated with specific activity nodes in the diagram. 📊
⚙️ Phase 3: Business Logic and Backend Services
This is the core of the system. The backend services process the business rules, manage state, and coordinate between different data sources. The activity diagram here needs to show the complexity of orchestration without becoming unreadable. 🧩
Core Processing Steps:
- Order Creation: A new record is initialized in the database.
- Inventory Check: The system verifies stock availability.
- Pricing Calculation: Taxes, discounts, and shipping fees are computed.
- Transaction Processing: The financial transaction is initiated.
Complex logic often requires parallel processing. For example, while the payment is being processed, the inventory can be reserved simultaneously. This is where Fork and Join nodes become essential. A Fork node splits the flow into two concurrent activities: one for payment and one for inventory. A Join node waits for both to complete before proceeding. ⚡
Without this visual representation, developers might implement these processes sequentially, leading to unnecessary latency. The diagram makes it clear that these operations are independent and can run in parallel. This optimization is often missed in text-based requirements documents. 🚀
💾 Phase 4: Database Operations and Consistency
Data integrity is paramount in any transactional system. The activity diagram must explicitly show how the database is accessed and how consistency is maintained. This includes transactions, locking mechanisms, and rollback procedures. 🗄️
Database Flow Considerations:
- Transaction Start: A database transaction is opened to ensure atomicity.
- Data Write: Records are updated or inserted.
- Commit or Rollback: Based on the success of the operation, the transaction is finalized or reverted.
- Indexing Updates: Search indices may be updated asynchronously.
In the diagram, database actions are often grouped under a specific swimlane labeled “Data Layer”. This separation clarifies which activities interact directly with storage. A decision node follows the write operation to check for constraints violations. If a constraint fails (e.g., duplicate key), the flow routes to a rollback activity. 🔁
Documenting rollback logic is often overlooked. By including it in the activity diagram, the team acknowledges that failures are part of the normal flow, not just edge cases. This mindset shift encourages better error handling in the code. 🛠️
🌍 Phase 5: External Integrations and Services
Modern systems rarely operate in isolation. They communicate with external payment gateways, email providers, and analytics services. These external dependencies introduce latency and potential points of failure. 📡
Integration Mapping Strategy:
- Timeout Handling: Define how long to wait for a response from an external service.
- Retry Logic: Specify if the system should retry the request automatically.
- Circuit Breaking: Determine when to stop calling a failing service to protect the main system.
For the activity diagram, external services are represented as separate entities connected by dashed lines. This distinguishes internal processing from external communication. If an external service times out, the flow should branch to a fallback strategy. This might involve queuing the request for later processing or notifying the user of a delay. ⏳
Mapping these integrations helps DevOps teams configure monitoring alerts. If a specific external node fails frequently, it becomes a visible metric in the diagram’s associated monitoring plan. 📈
🔄 Concurrency and Parallel Flows
Handling concurrency is one of the most challenging aspects of system design. The activity diagram provides a visual way to define how multiple threads or processes interact. This is crucial for performance optimization. ⏱️
Parallel Activity Patterns:
- Fork-Join: Splitting a task into sub-tasks that run simultaneously and merge upon completion.
- Parallel Wait: Waiting for multiple independent events to occur.
- Resource Locking: Ensuring that shared resources are not accessed simultaneously.
| Pattern | Diagram Representation | Use Case |
|---|---|---|
| Fork-Join | Split bar to Join bar | Parallel Payment & Inventory Check |
| Parallel Wait | Multiple incoming edges | Wait for Email & SMS Confirmation |
| Critical Section | Lock icon on node | Update User Balance |
When documenting concurrency, it is vital to specify the join condition. Does the flow wait for all parallel paths to finish, or just one? This decision affects system performance and resource usage. The diagram should explicitly label these join conditions to avoid implementation errors. 🎯
⚠️ Error Handling and Recovery
A robust system must handle errors gracefully. The activity diagram should not just show the success path; it must also map out failure scenarios. This includes network failures, database deadlocks, and validation errors. 🚨
Error Flow Best Practices:
- Isolate Errors: Keep error handling logic separate from the main flow to improve readability.
- Log Actions: Every error node should include a logging activity for auditing.
- User Feedback: Define how the user is informed about the failure.
- Recovery Steps: Indicate if automatic recovery is attempted before notifying the user.
By visualizing error paths, developers are reminded to write code that handles exceptions. It prevents the common mistake of assuming inputs will always be valid. The diagram acts as a checklist for the implementation phase. ✅
📋 Documentation and Maintenance
Once the workflow is mapped, the document must be maintained. Software evolves, and diagrams become outdated quickly if not managed. 📂
Maintenance Strategy:
- Version Control: Store diagram files alongside code repositories.
- Change Logs: Record when and why a workflow node was modified.
- Review Cycles: Schedule regular reviews to ensure diagrams match current code.
When a new feature is added, the activity diagram should be updated before coding begins. This ensures that the design is reviewed by peers. It also serves as a reference for onboarding new team members. 👨💻
Using swimlanes effectively helps assign ownership. Each swimlane can represent a specific team or service. This makes it clear who is responsible for which part of the workflow. It also helps in identifying handoff points where communication is critical. 🤝
🔍 Analysis and Optimization
The final step is to analyze the diagram for inefficiencies. Visualizing the flow often reveals bottlenecks that are not obvious in the code. 🔍
Optimization Checklist:
- Long Chains: Are there sequences of actions that could be parallelized?
- Redundant Checks: Are validation steps repeated unnecessarily?
- Dead Ends: Are there paths that lead to a final node without a proper outcome?
- Complexity: Are there too many decision nodes in a single view?
If a diagram becomes too complex, it should be decomposed. A high-level diagram can show the major phases, while detailed diagrams can focus on specific sub-workflows. This hierarchical approach keeps the documentation manageable. 📉
Performance metrics can be annotated on the diagram. For example, an activity node can be tagged with an average execution time. This helps identify which parts of the workflow contribute most to latency. 🕒
📝 Summary of Implementation
Mapping a full-stack workflow with UML Activity Diagrams is a disciplined approach to system design. It bridges the gap between abstract requirements and concrete implementation. By breaking down the process into frontend, middleware, backend, and data layers, teams gain a holistic view of the system. 🌍
The benefits extend beyond documentation. It improves communication, reduces bugs, and accelerates onboarding. When every team member understands the flow, collaboration becomes smoother. The visual nature of the diagram makes it easier to spot logic errors early in the development cycle. ⏳
Remember that the diagram is a living document. It should evolve with the system. Regular updates ensure that the documentation remains accurate and useful. By adhering to standard notation and focusing on clarity, teams can create reliable blueprints for complex software architectures. 🏗️
Ultimately, the goal is to build systems that are resilient, efficient, and maintainable. Activity diagrams provide the clarity needed to achieve that goal. They turn complex logic into a visual story that anyone on the team can understand. This shared understanding is the foundation of successful software engineering. 🏆