Creating effective UML activity diagrams requires more than simply connecting shapes with lines. It demands a structured approach to visual communication. When these diagrams are clear, they serve as a blueprint for logic, process, and system behavior. When they are cluttered, they become sources of confusion and error. This guide outlines the essential standards for designing diagrams that communicate complex workflows without overwhelming the reader.
📐 Understanding the Core Purpose
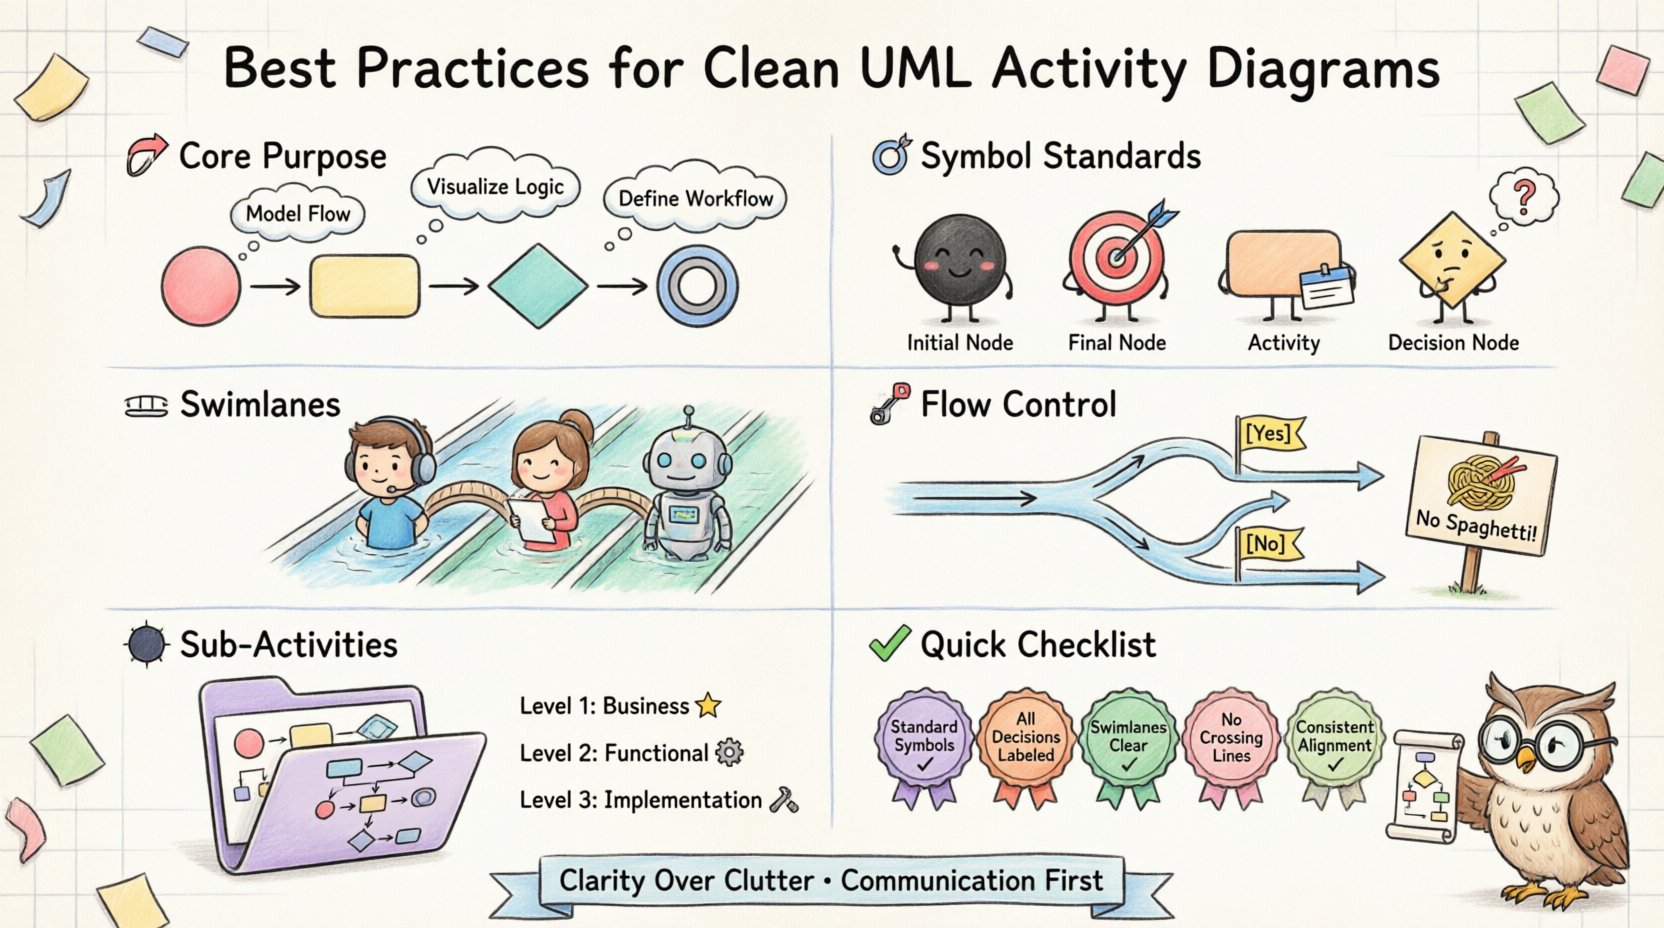
Before applying any stylistic rule, it is vital to understand what an activity diagram represents. It models the flow of control from one activity to another. It captures the dynamic behavior of a system. Unlike static structure diagrams, activity diagrams focus on movement, decision points, and concurrency.
- Process Modeling: Showing how a task progresses from start to finish.
- Algorithm Visualization: Mapping out the logic of a specific function.
- Workflow Definition: Defining the steps between actors or systems.
Clarity in these diagrams reduces the cognitive load on developers, stakeholders, and analysts. A clean diagram allows the viewer to trace the path of execution without guessing the intent.
🔤 Standardizing Symbols and Notation
Consistency is the foundation of readability. Every symbol in the Unified Modeling Language has a specific meaning. Deviating from these standards introduces ambiguity. The following table outlines the core symbols and their strict definitions.
| Symbol | Shape | Function | Common Pitfall |
|---|---|---|---|
| Initial Node | Filled Circle | Start of flow | Using a rectangle instead |
| Final Node | Double Ring | End of flow | Leaving paths without ends |
| Activity | Rounded Rectangle | Process step | Labeling with verbs instead of nouns |
| Decision Node | Diamond | Branching logic | Missing labels on branches |
| Object Flow | Arrow with Head | Data movement | Confusing with control flow | r>
When drawing these elements, adhere to the following guidelines:
- Initial Node: Always use a solid black circle. Do not label it “Start” unless necessary for specific contexts.
- Final Node: Use the concentric circle shape to indicate completion. Avoid using stop signs or generic icons.
- Decision Nodes: Every diamond must have at least two outgoing edges. One path leads to “True” or “Yes”, the other to “False” or “No”. Leaving a decision node without a label is a critical error.
- Activity Nodes: Use rounded rectangles. Keep the text inside concise. If an activity is too complex, break it into a sub-activity.
🏊 Managing Swimlanes and Partitions
Swimlanes divide the diagram into sections based on responsibility. This is crucial for showing who or what performs a specific action. Whether using vertical or horizontal lanes, the structure must remain consistent throughout the document.
🔹 Choosing Between Vertical and Horizontal
The orientation of swimlanes depends on the width of the process flow.
- Vertical Swimlanes: Best for processes that are wide but not particularly long. The reader scans down the lanes to see the sequence.
- Horizontal Swimlanes: Best for processes that are long and narrow. The reader scans across to see the progression.
Regardless of orientation, ensure the lane headers are clearly labeled. Ambiguity here destroys the value of the partition.
🔹 Avoiding Overlapping Responsibilities
Each activity should belong to exactly one lane. If an action requires multiple actors, decompose the activity. For example, do not place “Approve and Pay” in a single lane if “Approve” belongs to Finance and “Pay” belongs to Accounting. Split them into distinct steps within their respective lanes.
- Rule: One action, one lane.
- Rule: Cross-lane connectors must be explicit.
- Rule: Use junctions to transition between lanes cleanly.
🧭 Controlling Flow and Logic
The flow of control determines how the diagram is read. A logical flow prevents the reader from getting lost in a maze of arrows. This section covers how to manage the direction of the diagram and the complexity of the logic.
🔹 Directional Consistency
Flow should generally proceed from top to bottom or left to right. Avoid diagonal lines if possible. Diagonal connectors often imply a lack of planning and make the diagram harder to scan.
- Top to Bottom: The standard for vertical layouts. It mimics the way we read text in many languages.
- Left to Right: Ideal for horizontal layouts. It matches the progression of time.
When you must cross a lane, use a clear connector. Do not let lines cross over other elements without a visible junction. If lines cross, use a bridge symbol or a jump-over indicator to show they are not connected.
🔹 Handling Decisions and Guards
Decision nodes introduce branching. Each branch must have a guard condition. A guard condition is the boolean expression that determines the path.
Bad Example: An arrow leaving a diamond with no label.
Good Example: An arrow leaving a diamond labeled “[Valid]” and “[Invalid]”.
Ensure that all decision paths converge eventually. If a path leads to a dead end, the diagram is incomplete. Every branch must either lead to another activity or terminate at a final node.
- Check: Are all decision nodes labeled?
- Check: Do all branches have a destination?
- Check: Is the logic mutually exclusive?
🧩 Managing Complexity with Sub-Activities
As processes grow, a single diagram becomes too crowded. This is where sub-activities come into play. A sub-activity is an activity node that contains its own internal flow. It allows you to abstract complexity.
🔹 When to Use Folders
Use a sub-activity when:
- The internal logic is too detailed for the current view.
- The process is reused in multiple places.
- It improves readability by hiding unnecessary steps.
When defining a sub-activity, use a specific icon or notation to denote it is a separate diagram. This signals to the reader that clicking or expanding this box reveals more detail. Do not draw every single step in the main diagram.
🔹 Keeping Abstraction Levels Consistent
A common mistake is mixing high-level and low-level activities in the same view. If the main diagram shows “Process Order”, the steps should be “Validate Order”, “Check Inventory”, and “Charge Card”. Do not mix “Process Order” with “Calculate Tax Rate”. The latter is too granular for the parent level.
- Level 1: Business Process (High level)
- Level 2: Functional Flow (Mid level)
- Level 3: Implementation Logic (Low level)
Ensure that the transition between levels is clear. Use consistent naming conventions across levels.
🎨 Visual Layout and Spacing
The visual arrangement of elements affects how quickly the reader understands the diagram. White space is not wasted space; it is a tool for organization.
🔹 Avoiding Line Crossings
Lines crossing each other create visual noise. This is known as “spaghetti logic”. Try to route connectors so they do not intersect unless necessary.
- Use: Orthogonal lines (90-degree angles).
- Use: Buffer zones between parallel paths.
- Use: Junction nodes to merge flows cleanly.
If crossings are unavoidable, use a clear bridge symbol. Never rely on the reader to guess if a line connects or passes through another.
🔹 Alignment and Spacing
Elements should be aligned vertically or horizontally. A jagged layout suggests a lack of attention to detail. Align nodes within the same logical step.
- Alignment: Ensure activity nodes in the same step are vertically centered.
- Spacing: Maintain equal distance between parallel decision nodes.
- Consistency: Use the same font size and shape size throughout.
🛠️ Validation and Maintenance
Once the diagram is drawn, it must be validated. A diagram is a living document that represents a system. It requires regular review to ensure it matches reality.
🔹 Walkthroughs
Conduct a walkthrough with the team. Trace the flow from start to finish. Ask the following questions:
- Completeness: Are all possible paths accounted for?
- Feasibility: Can the system actually perform these steps?
- Clarity: Does a new team member understand the flow?
🔹 Version Control
Changes to the process require updates to the diagram. Do not overwrite old versions without tracking. Maintain a log of changes. This helps in debugging and auditing.
- Track: Date of change.
- Track: Reason for change.
- Track: Who approved the change.
⚠️ Common Pitfalls to Avoid
Even experienced practitioners make mistakes. Being aware of common errors helps in maintaining high quality.
| Pitfall | Consequence | Correction |
|---|---|---|
| Unlabeled Decision | Ambiguous logic | Add [Yes]/[No] labels |
| Missing End Node | Incomplete flow | Ensure every path ends |
| Crossing Lines | Confusion | Reroute or use bridges |
| Spaghetti Loops | Infinite logic risk | Use explicit join nodes |
| Inconsistent Symbols | Interpretation errors | Standardize notation |
🔗 Integrating with Other Diagrams
Activity diagrams do not exist in isolation. They interact with Use Case diagrams, Class diagrams, and Sequence diagrams. Consistency across these artifacts is key.
- Use Case Alignment: Ensure the activities match the use cases defined in the Use Case diagram.
- Class Alignment: Verify that the objects used in the activity flow exist in the Class diagram.
- Sequence Alignment: Check that the order of messages in a Sequence diagram matches the flow in the Activity diagram.
When discrepancies arise, update the documentation immediately. The model must reflect the design.
📝 Summary of Key Principles
To summarize the best practices for drawing clean and readable UML activity diagrams, focus on these core pillars:
- Standardization: Use official UML shapes and symbols.
- Clarity: Label every decision and flow.
- Organization: Use swimlanes to define responsibility.
- Simplicity: Break complex flows into sub-activities.
- Consistency: Maintain alignment and direction throughout.
- Validation: Review the diagram for completeness and accuracy.
By adhering to these guidelines, you ensure that your diagrams serve their primary purpose: communication. They become tools for understanding rather than obstacles to it. This approach fosters better collaboration and reduces the risk of misinterpretation during implementation.
Remember that a diagram is a representation of logic. If the logic is sound, the diagram should be easy to follow. If the diagram is hard to follow, the logic likely needs refinement. Treat the drawing process as an iterative refinement of the underlying process.
🚀 Next Steps for Implementation
Start by auditing your existing diagrams. Identify areas where clarity is lacking. Apply the rules discussed in this guide to one section of a project. Measure the improvement in team understanding. Gradually expand the practice to the entire documentation set.
Invest time in the design phase. It is easier to fix a diagram than it is to fix code based on a bad diagram. Prioritize readability over speed. The time saved during maintenance and debugging outweighs the initial drafting time.
Keep the audience in mind. A diagram for developers will differ slightly from one for business stakeholders. Adjust the level of technical detail accordingly, but never sacrifice the structural integrity of the notation.