


Planning complex, large-scale projects — whether it’s organizing a global conference or launching a new software product — demands precise coordination, clear task dependencies, and robust scheduling logic. Traditionally, project managers have spent significant time manually constructing network diagrams, calculating critical paths, and managing task interdependencies. This process, often tedious and error-prone, has been a persistent bottleneck in high-stakes environments.
Introducing the Future of Project Modeling: AI-Driven PERT Chart Generation
EnterVisual Paradigm’s AI-powered PERT chart generator — a transformative tool that leverages generative artificial intelligence to convert natural language project descriptions into fully structured, interactive, and professionally formatted PERT diagrams in seconds. This shift from manual drafting to intelligent automation allows project leaders to focus on strategic planning, risk assessment, and decision-making, rather than time-consuming network diagramming.
How It Works: From Concept to Critical Path
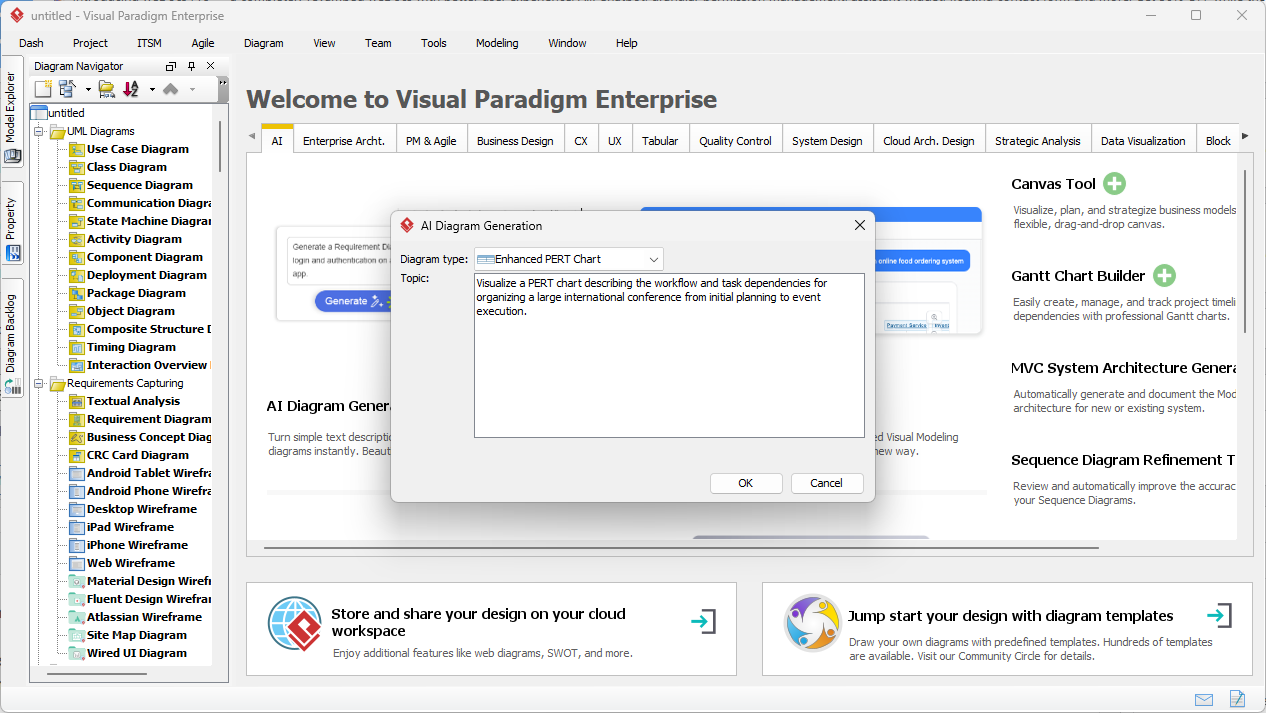
The process begins with a simple natural language prompt. For example, a project manager might input: ‘Organize an international conference from planning to execution, including marketing, venue booking, speaker coordination, and post-event follow-up.’
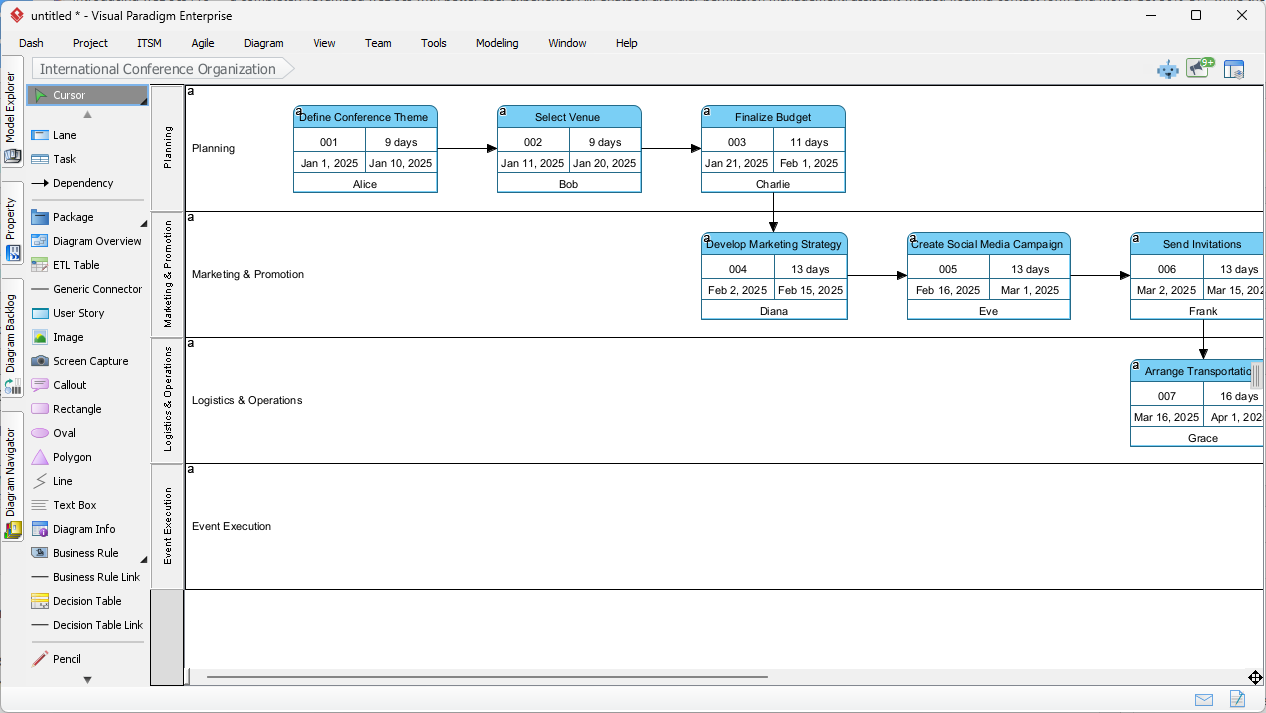
Visual Paradigm’s AI engine analyzes the textual input to identify key phases, milestones, and logical dependencies. It then automatically organizes these into a structured workflow across thematic swimlanes such as:
- Planning & Strategy
- Marketing & Promotion
- Logistics & Operations
- Event Execution
- Post-Event Evaluation
Each node in the resulting PERT chartincludes critical metadata: task ID, duration, assigned personnel (e.g., Alice, Bob), and dependency logic. The AI ensures that tasks are sequenced logically — for instance, marketing cannot begin until research and venue selection are completed — effectively modeling real-world workflow constraints.
Professional Standards, Automated Precision
Unlike generic diagramming tools,Visual Paradigm’s AIstrictly adheres to industry standards for PERT charting. This includes:
- Use of event nodes (circles or rectangles) and activity arrows
- Implementation of the PERT three-point estimation formula: TE = (O + 4ML + P) / 6, where O = optimistic, ML = most likely, P = pessimistic
- Automatic calculation of early start/finish (ES/EF), late start/finish (LS/LF), and slack (float) values
This ensures that the output is not just visually appealing but also technically sound — suitable for inclusion in formal project documentation, risk reports, or PMP-level project briefs.
Real-Time Critical Path Analysis
One of the most valuable features of the AI PERT generator is its ability to automatically detect the critical path — the longest sequence of dependent tasks that determines the minimum project duration. In a conference planning scenario, this might be:
| Task | Duration (Days) | Dependency | Slack |
|---|---|---|---|
| Research & Stakeholder Mapping | 10 | Start | 5 days |
| Marketing Strategy Development | 14 | After Research | 0 days |
| Speaker Booking & Contracts | 12 | After Marketing | 0 days |
| Logistics & Venue Finalization | 8 | After Marketing | 0 days |
| Event Execution | 16 | After Logistics | 0 days |
The AI highlights the entire path from research to execution as the critical path, with zero slack. This immediately signals to the project team that delays in any of those activities will directly extend the project timeline — a key insight for resource allocation and risk mitigation.
Dynamic Scenario Testing and Risk Modeling
The true power of AI-powered PERT tools lies in their ability to support dynamic scenario analysis. With a few edits to the prompt, users can explore different versions of the project:
- Best-case scenario: Reduce marketing duration by 5 days and assume early speaker availability.
- Pessimistic case: Add 10-day delays to logistics due to unforeseen travel restrictions or visa issues.
- What-if analysis: Explore shifting the start of market research to Week 3 instead of Week 1.
Each variation generates a new PERT chart with updated critical paths, durations, and dependencies. This enables project managers to present stakeholders with a comprehensive risk assessment — not just a timeline, but an understanding of how uncertainty impacts delivery.
Hybrid Human-AI Workflow: Precision Meets Expertise
While the AI handles 80% of the structural and computational workload — including dependency mapping, node placement, and path calculation — the final 20% of refinement is left to human expertise. This hybrid model ensures both speed and accuracy.
For example, a project manager might:
- Generate a PERT chart using a natural language prompt
- Adjust task durations based on team capacity
- Modify dependencies to reflect actual team availability
- Add resource constraints or resource leveling rules
- Export the model as a Gantt chart or embed it into a project management dashboard
This workflow is particularly effective in agile or matrix-based environments where timelines and team responsibilities evolve rapidly.
Multi-Platform Access and Flexibility
Visual Paradigm offers two complementary access points:
- Desktop Edition: Full-featured modeling environment with deep editing capabilities, ideal for enterprise teams managing complex, long-term projects.
- AI Chatbot (Online): A lightweight, browser-based interface accessible on any device. Ideal for real-time brainstorming, live meetings, or quick ideation sessions where users simply type: ‘Generate a PERT chart for a mobile app launch.’
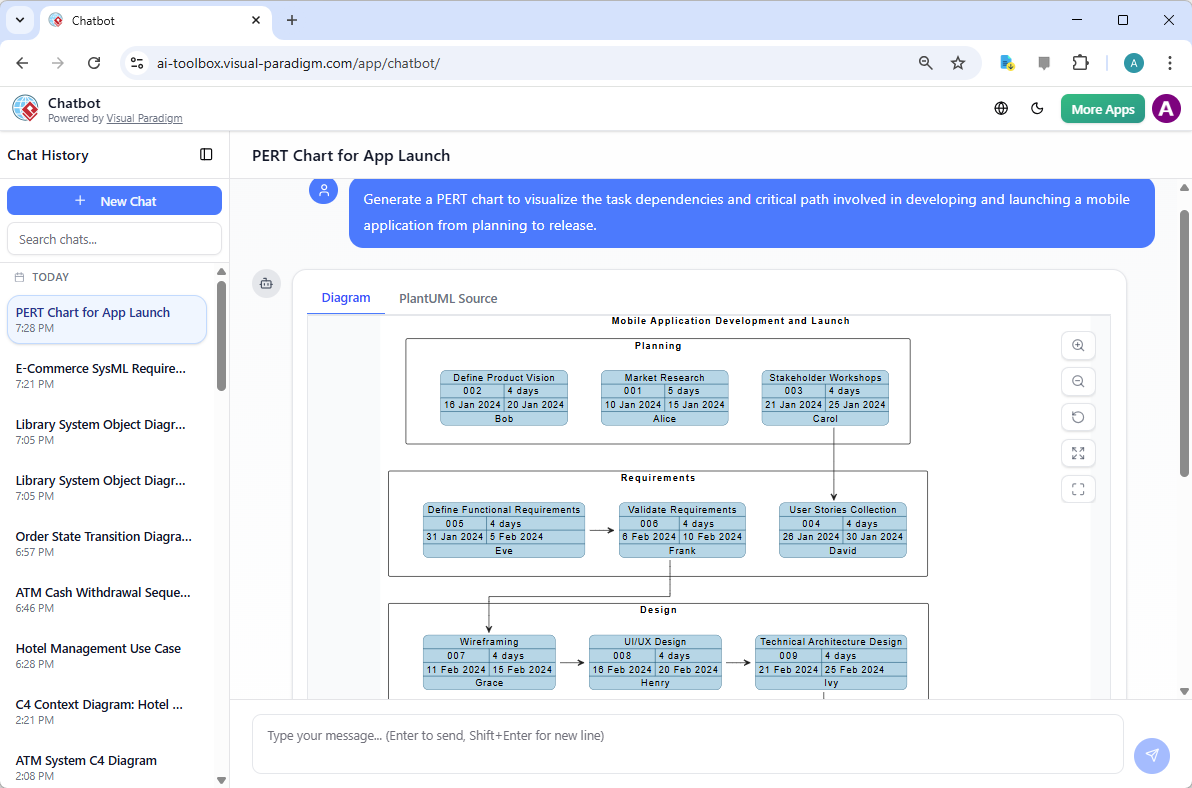
The chatbot provides immediate visualization with source logic (e.g., PlantUML) displayed side-by-side, enabling transparency in how the AI derived the network structure. This is especially valuable for non-technical stakeholders or team leads who need to quickly understand project flow without deep modeling training.
Use Cases in Real-World Project Management
Here are practical workflows where AI PERT chart generation delivers tangible value:
Workflow 1: From Vision to Network Diagram
- Open Visual Paradigm Desktop
- Use the AI Diagram Generator to input: ‘Plan a three-day tech summit featuring 50 speakers, with registration, venue, and content scheduling.’
- Review the automatically generated PERT chart with swimlanes, dependencies, and critical path highlighted
- Refine durations and assign personnel
- Save and share the model in the team’s project repository
Workflow 2: Risk Assessment and Scenario Planning
- Generate a baseline PERT chart under optimized assumptions
- Modify the prompt to include: ‘Add 15-day delay for travel logistics; assume 20% chance of speaker cancellations.’
- Regenerate the chart and compare total project duration and critical path
- Present findings to leadership with a risk-adjusted timeline
Why This Matters for Modern Project Management
Traditional project scheduling relies on manual calculations and spreadsheets, which are prone to human error and lack real-time responsiveness. In contrast, AI-driven PERT charting offers:
- Rapid prototyping: Convert project descriptions into visual models in under a minute
- Automated critical path analysis: Instantly identify the path that defines project duration
- Probabilistic scheduling: Model uncertainty using three-point estimates
- Seamless refinement: Transition from AI draft to detailed Gantt, resource leveling, and calendar views
- Improved collaboration: Share editable models with cross-functional teams
These capabilities are especially critical in today’s volatile environment, where project timelines are frequently disrupted by external factors such as supply chain issues, labor shortages, or political changes.
Conclusion: The New Standard in Project Planning
The integration ofgenerative AI into visual modeling marks a fundamental shift in project management. Tools like Visual Paradigm’s AI PERT chart generator eliminate the time-consuming, error-prone aspects of manual scheduling, replacing them with intelligent, dynamic, and transparent models.
Whether you’re orchestrating a global conference or launching a next-generation mobile application, this approach enables teams to:
- Visualize complex dependencies with clarity
- Identify and mitigate risks early
- Conduct ‘what-if’ analysis rapidly
- Communicate project timelines with confidence to stakeholders
By combining the precision of formal project methodologies with the flexibility of natural language input, AI-powered PERT charting is no longer a futuristic concept — it is the new standard in professional project planning.
Ready to transform your project planning? Experience the power of AI-driven visual modeling with Visual Paradigm. Start generating professional PERT charts, UML diagrams, and enterprise architecturemodels in minutes. Try the AI Diagram Generator in the desktop edition or explore the AI Chatbot online for instant, browser-based modeling.
Download Visual Paradigm to unlock full AI modeling capabilities or begin with the AI Chatbot in your browser.
Articles and resources related to Visual Paradigm’s AI capabilities and PERT Chart tools for project management:
-
Pert Chart Tool – Visual Paradigm Online: A powerful online tool designed to help project managers visualize task dependencies, estimate timelines, and manage project schedules effectively.
-
Complete PERT Chart Tutorial – Visual Paradigm: A step-by-step tutorial guiding users through creating and using PERT charts in the cloud to plan and manage complex projects efficiently.
-
Pert Chart User Guide – Visual Paradigm: Detailed documentation covering how to create, edit, and utilize PERT charts within the desktop software for robust project management.
-
Free PERT Chart Templates – Visual Paradigm: Access a collection of professionally designed templates to kickstart project planning with minimal setup.
-
Pert Chart Tutorial – Visual Paradigm Knowledge Base: An in-depth resource explaining the purpose, construction, and application of PERT charts in real-world project management scenarios.
-
Enhanced PERT Chart Features – Visual Paradigm: Explore advanced capabilities such as dynamic scheduling, critical path analysis, and seamless integration with project timelines.
-
Project Management Guide – Visual Paradigm User Guide: A comprehensive guide to the platform’s project management suite, including PERT charts, Gantt charts, and resource allocation tools.
-
Pert Chart for Project Management – Cybermedian: This article provides practical insights and real-world online examples for using PERT charts to improve project planning.
-
Integrating PERT Charts with RACI Roles in Task Management: A practical guide on combining PERT charts with RACI roles to enhance timeline accuracy and accountability in management workflows.
-
Visual Paradigm AI Suite: A Comprehensive Guide: This overview details how the platform’s AI Chatbot supports the generation of business diagrams, explicitly including PERT charts, within the modeling environment.