


Designing real-time systems requires precision. When signals must arrive within specific windows, and state changes must occur predictably, standard modeling often falls short. You are dealing with logic that does not just flow; it pulses, waits, and expires. In this landscape, choosing the right Unified Modeling Language (UML) notation is not merely a stylistic choice. It is a critical engineering decision that impacts system correctness.
Two primary diagram types dominate discussions around interaction modeling: the UML Sequence Diagram and the UML Timing Diagram. Both visualize behavior, yet they capture different dimensions of system reality. One focuses on the order of messages; the other focuses on the duration and state of objects over time.
This guide provides a deep technical comparison. We will dissect how each diagram handles synchronization, latency, and state constraints. By the end, you will understand exactly when to deploy a timing diagram versus a sequence diagram for your real-time logic architecture.
📡 Understanding the Sequence Diagram in Real-Time Context
The UML Sequence Diagram is the industry standard for visualizing interaction order. It maps out how objects communicate over time, arranging objects vertically and messages horizontally. In the context of real-time logic, it excels at defining the logical flow rather than the physical duration.
- Focus: Message passing and control flow.
- Time Axis: Implicit. Time flows from top to bottom, but scale is not defined.
- Key Elements: Lifelines, activation bars, messages (synchronous/asynchronous), and return values.
- Best For: Defining the algorithm, the handshake protocols, and the sequence of operations.
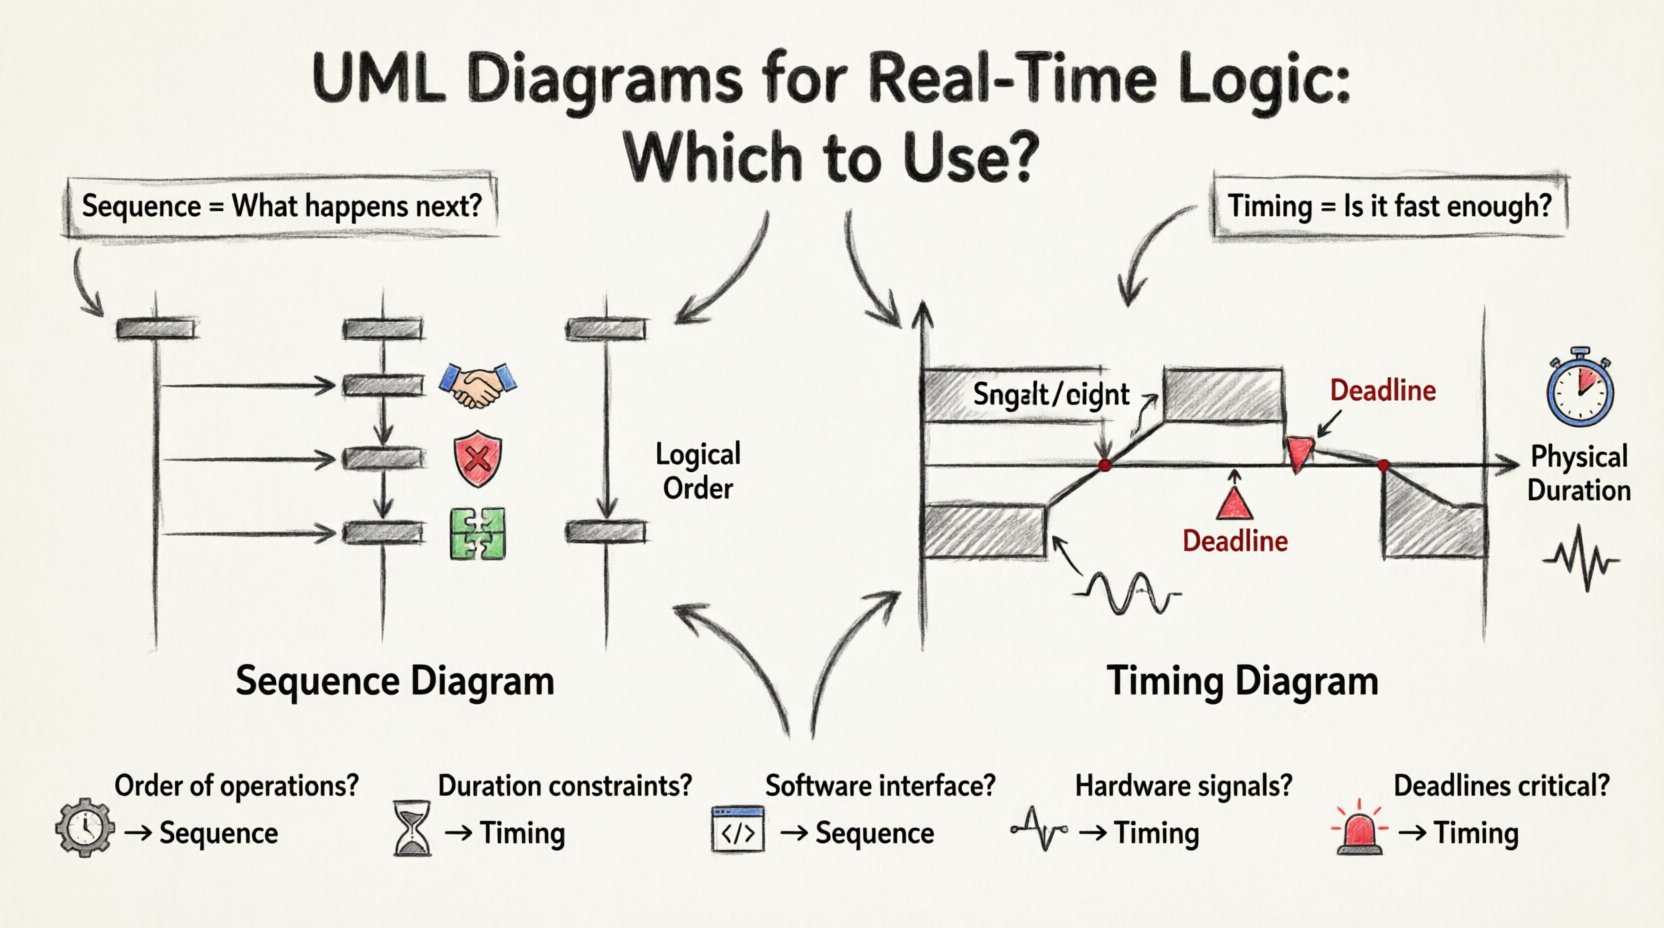
When modeling a real-time system, the sequence diagram answers the question: “What happens next?” It is invaluable for debugging race conditions that depend on the order of execution rather than the speed of execution.
Key Components of a Sequence Diagram
To use this tool effectively, you must understand its structural vocabulary:
- Lifelines: Represent instances of classes or components. In real-time systems, these often represent sensors, controllers, or communication buses.
- Activation Bars: Show when an object is performing an action. This indicates control transfer.
- Synchronous Messages: Represented by solid arrows. The sender waits for a response before proceeding. This is critical for blocking logic.
- Asynchronous Messages: Represented by open arrows. The sender continues immediately. This models fire-and-forget scenarios common in event-driven architectures.
- Combined Fragments: Boxes like
alt,opt, andloopallow you to model conditional logic and iterations without cluttering the diagram.
⏱️ Understanding the Timing Diagram in Real-Time Context
The UML Timing Diagram is often overlooked, yet it is the definitive tool for modeling time-critical behavior. Unlike the sequence diagram, which abstracts time, the timing diagram treats time as a primary axis. It shows how the state of an object changes over a specific timeline.
- Focus: State changes and signal values over time.
- Time Axis: Explicit. Runs horizontally across the top of the diagram.
- Key Elements: State machines, value ranges, signal transitions, and deadlines.
- Best For: Defining latency constraints, jitter analysis, and state validity windows.
In real-time logic, the timing diagram answers the question: “Is this happening fast enough, and for how long?” It is essential when the system must respond to a sensor input within 5 milliseconds or maintain a signal voltage above a threshold for a specific duration.
Key Components of a Timing Diagram
Mastering this diagram requires attention to its temporal mechanics:
- Time Scale: The horizontal axis represents time. It can be absolute (clock time) or relative (elapsed time).
- State Bars: Horizontal bars indicate the state of an object (e.g., Active, Idle, Error). The length of the bar represents duration.
- Value Ranges: Instead of discrete messages, you often see value ranges (e.g., Voltage: 0V to 5V). This is crucial for physical systems.
- Signal Transitions: Vertical lines crossing the state bars indicate a change in value or state.
- Constraints: Text boxes or annotations can specify hard deadlines (e.g.,
<deadline>).
🆚 Core Differences: A Technical Comparison
To make an informed decision, we must look at the structural and semantic differences between these two notations. The following table outlines the distinctions relevant to real-time system design.
| Feature | Sequence Diagram | Timing Diagram |
|---|---|---|
| Time Representation | Logical order (Top to Bottom) | Physical duration (Horizontal Axis) |
| Primary Focus | Interaction flow and control | State evolution and signal values |
| Message vs. State | Focuses on message passing | Focuses on state changes and values |
| Concurrency | Shows parallel lifelines clearly | Shows parallel activities over time |
| Deadlines | Implied via message order | Explicit via time scale and constraints |
| Complexity | High cognitive load for long chains | High cognitive load for many signals |
🛠️ When to Use a Sequence Diagram for Real-Time Logic
While timing diagrams excel at temporal precision, sequence diagrams remain the backbone of interaction modeling. You should prioritize the sequence diagram when:
- Protocol Definition: You are defining a communication protocol (e.g., MQTT, TCP/IP handshake). The order of SYN, ACK, and FIN packets is more important than the exact millisecond delay.
- Error Handling: You need to visualize how the system reacts to failures. How does the controller retry a request? How does it notify the user? Sequence diagrams handle branching logic (alt/opt fragments) better.
- Component Integration: You are mapping the interaction between distinct software modules. Who calls whom, and what data is passed?
- Algorithm Logic: The core complexity lies in the decision tree, not the execution time. If the logic is
if (x > 5) then do_y, a sequence diagram captures this flow clearly. - Asynchronous Events: Real-time systems often rely on interrupts. Sequence diagrams are excellent for showing an interrupt occurring while a main loop is running, provided you use combined fragments.
Example Scenario: An automated braking system receives a sensor input. The sequence diagram would show the sensor sending data to the controller, the controller processing the input, and then sending a command to the brake actuator. It maps the logical dependency.
🕒 When to Use a Timing Diagram for Real-Time Logic
The timing diagram becomes mandatory when time itself is a variable in the logic. You should switch to this notation when:
- Hard Deadlines Exist: If a task must complete within 10ms, or the system fails, a timing diagram visualizes the window. You can explicitly draw a vertical line marking the deadline.
- Signal Stability Matters: In embedded systems, signals often need to remain high for a specific duration to be recognized. A timing diagram shows the pulse width requirements.
- Jitter Analysis: If the system must handle variable delays (jitter), a timing diagram can show the range of possible arrival times for a message.
- Resource Contention: When two processes compete for a CPU core, a timing diagram can show the scheduling gaps and how one task blocks the other.
- State Machine Transitions: If a device must wait in a “Warm Up” state for 5 seconds before entering “Active” mode, the duration is the critical constraint. A timing diagram makes this explicit.
Example Scenario: A temperature sensor sends data every 100ms. The controller must process this data before the next reading arrives. A timing diagram shows the overlap (or lack thereof) between the reading interval and the processing duration.
🔍 Deep Dive: Handling Concurrency and Synchronization
Real-time logic is rarely linear. Concurrency is the norm. Both diagram types handle this differently, and understanding the nuance is vital for architecture.
Concurrency in Sequence Diagrams
Sequence diagrams use parallel lifelines to show concurrency. If two objects are active simultaneously, their activation bars run side-by-side. However, this does not guarantee simultaneous execution in time. It only guarantees logical interleaving.
- Limitation: You cannot easily show that Process A must finish before Process B starts, regardless of order, if they are on different threads.
- Best Practice: Use
parfragments to denote parallel execution blocks. This clarifies that the system expects multiple threads or processes to run concurrently.
Concurrency in Timing Diagrams
Timing diagrams handle concurrency spatially. Because time flows horizontally, you can stack multiple lifelines and see exactly where they overlap in time.
- Advantage: You can see if a “Busy Wait” loop actually blocks other tasks. You can visualize the gap between a task starting and another task ending.
- Limitation: They can become cluttered quickly if you have many concurrent threads. The visual noise increases as the number of signals increases.
🧩 Integrating Both Diagrams
In robust engineering, you rarely choose one and discard the other. The most effective documentation strategy integrates both. They serve complementary roles in the design lifecycle.
- High-Level Design: Start with Sequence Diagrams to define the architecture, the message flow, and the component boundaries. This sets the logical contract.
- Low-Level Specification: Refine critical paths with Timing Diagrams. Once the logic is defined, apply temporal constraints to the critical sections. This defines the performance contract.
- Verification: During testing, use the timing diagram to verify latency. Use the sequence diagram to verify that the correct messages were exchanged in the correct order.
⚠️ Common Pitfalls to Avoid
Even experienced architects make mistakes when modeling real-time systems. Be vigilant against these common errors.
- Assuming Sequence Implies Duration: A common mistake is looking at a sequence diagram and assuming the vertical distance between messages represents time. It does not. This leads to incorrect latency assumptions.
- Ignoring Idle States: In timing diagrams, failure to represent the “Idle” or “Sleep” state can hide power consumption issues. Ensure your state bars cover the entire lifecycle.
- Overusing Combined Fragments: In sequence diagrams, nesting too many
altoroptblocks makes the diagram unreadable. Split complex logic into sub-diagrams. - Mixing Logical and Physical Time: Do not mix logical ordering (sequence) with physical time constraints (timing) in the same diagram unless clearly labeled. Keep them distinct to avoid confusion.
- Neglecting Signal Noise: In timing diagrams for physical hardware, do not assume perfect signal transitions. Indicate noise margins or debounce times if they affect logic.
📝 Best Practices for Documentation
To ensure your diagrams add value rather than clutter, follow these guidelines.
- Consistent Naming: Use consistent naming conventions for lifelines and signals. If you call a signal “ReadSensor” in one diagram, do not call it “GetData” in another.
- Focus on Critical Paths: Do not try to diagram every single function. Focus on the paths that involve timing constraints or critical failures. Document the happy path briefly, but detail the edge cases.
- Use Annotations: Both diagram types support annotations. Use them to define units (ms, µs), tolerances, and specific requirements. A number without a unit is meaningless in real-time design.
- Version Control: Treat diagrams as code. Store them in version control. Changes to timing constraints should be reviewed just like code changes.
- Review with Stakeholders: Review sequence diagrams with developers (logic). Review timing diagrams with system engineers (performance). Ensure the audience matches the diagram type.
🚀 Advanced Considerations: State Machines
Real-time systems are often event-driven. This brings us to the intersection of State Machines and UML diagrams.
- Sequence Diagrams + State Machines: Use sequence diagrams to show how a state machine transition is triggered by an external message. Show the message entering the lifeline and the internal state change occurring.
- Timing Diagrams + State Machines: Use timing diagrams to show the duration of a state. For example, a “Timeout” state might last exactly 3 seconds. The timing diagram visualizes this duration relative to other events.
When modeling complex embedded logic, combining a State Machine diagram with a Timing Diagram is often the most accurate representation of behavior over time.
📊 Summary of Decision Factors
To assist in your decision-making process, consider this checklist.
- Is the primary concern the order of operations? ➝ Use Sequence Diagram.
- Is the primary concern the duration of an operation? ➝ Use Timing Diagram.
- Are you defining a software interface? ➝ Use Sequence Diagram.
- Are you defining a hardware signal requirement? ➝ Use Timing Diagram.
- Does the logic depend on deadlines? ➝ Use Timing Diagram.
- Does the logic depend on message protocols? ➝ Use Sequence Diagram.
🔚 Final Thoughts
Selecting between a UML Timing Diagram and a Sequence Diagram is not about preference; it is about fidelity to the system’s constraints. Sequence diagrams map the logic of interaction. Timing diagrams map the physics of execution.
In the realm of real-time logic, ambiguity is the enemy. By choosing the right tool, you reduce ambiguity. You provide your team with a clear blueprint that distinguishes between what the system does and when it must do it. This clarity translates directly to robust, reliable, and safe systems.
Start with the flow. Validate the timing. Document both. This dual approach ensures that your real-time logic is not only functionally correct but temporally sound.