


Software systems often grow into intricate webs of dependencies, conditional branches, and state transitions. When developers and business stakeholders attempt to visualize these processes, natural language descriptions frequently fail to capture the nuances of execution flow. This is where the Unified Modeling Language (UML) Activity Diagram becomes an essential tool. It provides a standardized visual representation of the dynamic behavior within a system, focusing on the flow of control and data.
By breaking down complex logic into atomic activities and connecting them with clear control flows, these diagrams reduce ambiguity. They serve as a bridge between high-level business requirements and low-level implementation details. This guide explores the mechanics of constructing these diagrams, ensuring clarity for both technical and non-technical audiences.
🧠 Understanding the Core Purpose
An activity diagram is essentially a flowchart for complex systems. While it shares similarities with standard process maps, it includes specific notations for concurrency, object flow, and exception handling. The primary objective is not merely to document what happens, but to describe how actions are triggered, sequenced, and terminated.
Consider a scenario involving an automated order processing system. Without a diagram, the logic might exist scattered across requirements documents and code comments. A unified view reveals:
- Entry Points: Where does the process begin?
- Decision Nodes: Where does the logic branch?
- Concurrent Processes: Which actions happen simultaneously?
- Exit Points: How does the system conclude a transaction?
These visualizations allow stakeholders to validate logic before a single line of code is written. They expose logical gaps, such as missing exception handlers or unreachable states, significantly reducing the cost of change during later development phases.
📐 Key Components and Notation
To construct a meaningful diagram, one must understand the building blocks. Each symbol carries a specific semantic meaning that dictates how the process executes.
1. Initial Node
Represented by a solid filled circle, this marks the single entry point of the activity. All flows must originate from here. It is crucial to ensure there is only one initial node per diagram to maintain a clear starting state.
2. Activity Node
These are the rounded rectangles representing a phase of work. They can be:
- Atomic: A single action that cannot be subdivided (e.g., “Validate User Input”).
- Structured: A complex activity that contains its own sub-activities (e.g., “Process Payment”).
3. Control Flow
Directed arrows connecting nodes. These indicate the sequence of execution. The arrowhead points to the node that follows the current action.
4. Decision and Merge Nodes
These are diamond shapes. A Decision Node splits the flow based on a condition (e.g., “Is Amount > 0?”). A Merge Node brings multiple flows back together. It is vital to label the outgoing edges from decision nodes with the specific condition that triggers that path.
5. Fork and Join Nodes
Forks represent the start of concurrent execution. A thick horizontal bar indicates that all outgoing flows begin simultaneously. Joins represent the synchronization point where concurrent flows must converge before proceeding. This is essential for modeling parallel processing requirements.
6. Final Node
Similar to the initial node but with a border, indicating the termination of the activity. A diagram may have multiple final nodes to represent different success or failure outcomes.
🚀 Constructing the Diagram: A Step-by-Step Walkthrough
Creating an accurate diagram requires a disciplined approach. It is not enough to draw shapes; the logic must hold up under scrutiny. Follow this methodology to ensure robust modeling.
Step 1: Define the Scope and Trigger
Identify the specific business event that initiates the process. Is it a user login? A scheduled batch job? A sensor reading? Write this down as the precondition.
- Input: User ID, Timestamp.
- Output: Session Token, Audit Log Entry.
- Constraint: Must complete within 5 seconds.
Step 2: Identify Major Activities
Break the high-level goal into major functional blocks. Avoid getting bogged down in micro-details at this stage. Group related actions into structured activities.
- Authenticate Request
- Retrieve Data
- Process Calculation
- Generate Report
Step 3: Map the Control Flow
Connect the major activities using control flows. Determine the sequence. Ask yourself: “Does Activity B happen immediately after Activity A?” If there are conditions, insert decision nodes.
Step 4: Handle Concurrency
If tasks can run in parallel, introduce fork nodes. Ensure that you have corresponding join nodes to synchronize the threads. For example, if sending an email and updating a database can happen simultaneously, fork the flow after the “Save Record” activity and join it before the “Notify User” activity.
Step 5: Review and Refine
Walk through the diagram logically. Start at the initial node and trace paths to the final nodes. Verify that every path has a termination point and that no deadlocks exist where a join node waits indefinitely for a forked path that has already terminated.
⚡ Managing Concurrency and Control Flow
One of the most powerful features of this modeling technique is the ability to depict parallelism. In modern systems, sequential processing is often inefficient. Modeling concurrency correctly prevents race conditions and ensures resource availability.
When using fork and join nodes, consider the synchronization policy:
- Wait for All: The join node waits for all incoming flows to arrive. This is the standard behavior.
- Wait for One: The join node proceeds as soon as any one incoming flow arrives. This is useful for timeout scenarios.
Additionally, object flows can be used to show data moving between activities. While control flows move execution, object flows move data instances. This distinction is critical when modeling state changes. For instance, an “Update Database” activity might receive an “Order Object” as input and produce a “Receipt Object” as output.
🏊 Using Swimlanes for Clarity
When multiple actors (users, systems, or departments) are involved, a flat diagram becomes messy. Swimlanes partition the diagram by responsibility. This visual separation clarifies who is responsible for each action.
Common swimlane categories include:
- Frontend: User interface interactions.
- Backend: Server-side logic and processing.
- Database: Data storage and retrieval operations.
- External System: Third-party APIs or services.
When drawing across swimlanes, use control flows that cross the lane boundaries. This highlights the handoff points where one actor passes responsibility to another. This is particularly useful for identifying integration points and potential bottlenecks in communication.
⚠️ Common Pitfalls to Avoid
Even experienced modelers can introduce errors that obscure meaning. Be vigilant against these common issues:
- Overlapping Logic: Ensure that decision nodes do not create overlapping conditions. Every path must be mutually exclusive where branching occurs.
- Missing Error Handling: A diagram that only shows the happy path is incomplete. Include paths for exceptions, such as “Database Connection Failed” or “Invalid Input”.
- Unreachable Nodes: Check for parts of the diagram that cannot be reached from the initial node. These are dead code in the logic model.
- Infinite Loops: While loops are valid, ensure there is a clear exit condition. Visual loops without a merge node can confuse the reader about when the process ends.
- Excessive Detail: Do not model every single line of code. Keep the abstraction level appropriate for the audience. A high-level business process diagram should not contain implementation-specific variable assignments.
🔄 Integrating with Other Models
An activity diagram does not exist in isolation. It works best when integrated with other UML artifacts to provide a complete picture of the system architecture.
| UML Artifact | Primary Focus | Relationship to Activity Diagram |
|---|---|---|
| Sequence Diagram | Object interactions over time | Details the specific messages exchanged during an activity. |
| Class Diagram | Static structure and attributes | Defines the objects that are passed through object flows. |
| State Machine Diagram | Object lifecycle states | Can be nested within an activity to show state changes of specific entities. |
| Component Diagram | System architecture | Identifies which components execute specific activities. |
Using these diagrams together creates a robust documentation suite. The activity diagram provides the “when and how,” while the class and sequence diagrams provide the “who and what.”
📉 Deep Dive: Handling Complex Exceptions
Real-world systems are rarely linear. They encounter failures, timeouts, and user rejections. A robust activity diagram must account for these deviations. The standard way to model this is through exception handlers.
When a specific activity fails, the flow should divert to an error handling routine. For example, if the “Send Notification” activity fails, the flow might divert to “Log Error” and then “Retry” or “Notify Admin.” This ensures that the system does not simply stop but transitions to a safe state.
Key strategies for exception modeling include:
- Explicit Error Paths: Draw arrows from activity nodes to exception handling nodes explicitly.
- Guard Clauses: Use conditions on decision nodes to route errors (e.g., [Success], [Failure]).
- Global Handlers: In some architectures, a single catch-all handler manages all unexpected exceptions. Model this as a centralized node.
📝 Summary of Best Practices
To maximize the utility of your diagrams, adhere to these principles:
- Consistency: Use the same notation style throughout the document. Do not mix UML 2.0 and older notations.
- Readability: Avoid crossing lines where possible. Use orthogonal routing for flows to make the diagram look clean.
- Labeling: Every node and edge should have a clear, descriptive label. Avoid abbreviations unless they are industry-standard.
- Hierarchy: Use structured activities to hide complexity. If a sub-process is complex, create a separate diagram for it and reference it.
- Version Control: Treat diagrams as code. They change as the system changes. Maintain a revision history.
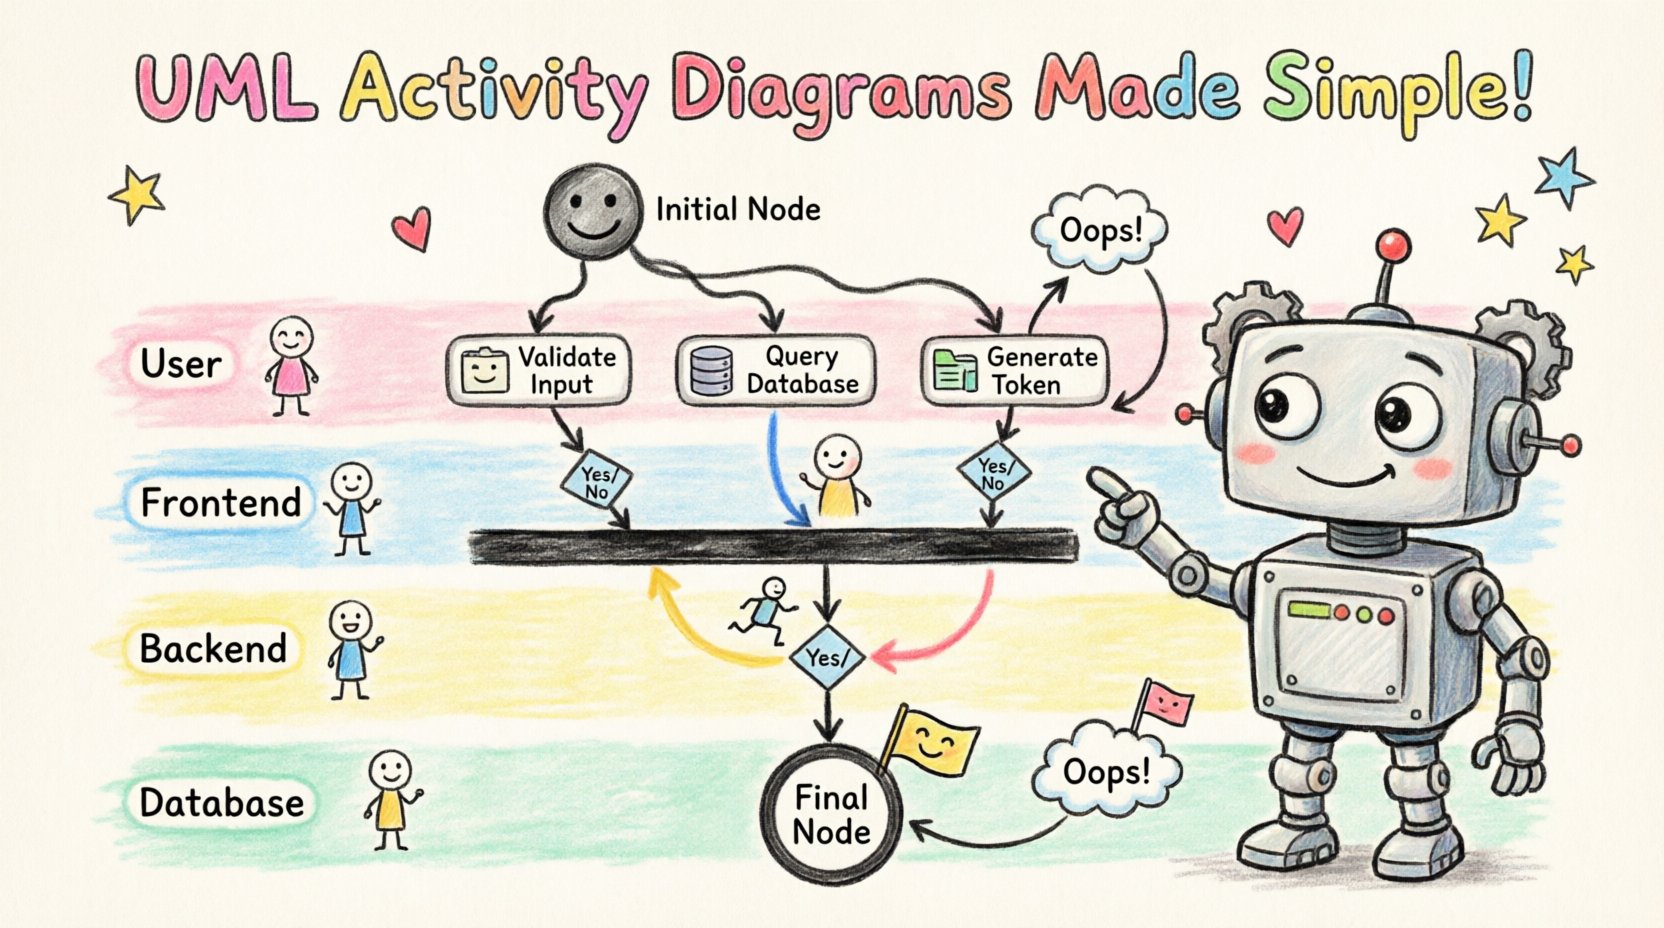
🛠️ Practical Example: User Authentication Flow
Let us apply these concepts to a concrete example: a user login system.
- Initial Node: User enters credentials.
- Activity: Validate Input Format.
- Decision: Is Format Valid?
- If No: Show Error Message → End.
- If Yes: Proceed to Query Database.
- Activity: Query User Database.
- Decision: Are Credentials Correct?
- If No: Log Attempt → Increment Fail Count → Decision: Max Attempts Reached?
- If Yes: Lock Account → End.
- If No: Return to Input.
- If Yes: Generate Token → Update Last Login Time → End.
This example demonstrates the handling of loops (retry logic), decisions (validity checks), and concurrent updates (logging and token generation). By visualizing this, developers can verify that account locking logic exists and that failed attempts are tracked.
🔍 Final Thoughts on Visualization
Complex logic requires complex thinking tools. Simple text descriptions often fail to capture the nuance of conditional execution and parallel processing. Activity diagrams provide a rigorous framework for mapping these behaviors.
By following the step-by-step methodology outlined above, teams can create artifacts that serve as both design documents and communication tools. They reduce the cognitive load required to understand system behavior and provide a clear basis for testing and validation. The investment in modeling pays dividends in reduced defects and clearer stakeholder alignment.
Remember that the goal is clarity, not artistic perfection. A diagram that is quickly understood and accurately reflects the logic is superior to a complex, beautiful one that confuses the reader. Focus on the flow, respect the notation standards, and always keep the end-user experience in mind.
As systems evolve, so should your diagrams. Regular reviews ensure that the visual representation matches the actual codebase. This synchronization is the hallmark of mature engineering practices. Start with the trigger, map the path, handle the exceptions, and verify the end state. This disciplined approach will simplify even the most tangled logic.