When designing complex systems, understanding when things happen is just as critical as understanding what happens. Standard sequence diagrams show the order of interactions, but they often fail to capture the duration of activities or the specific timing constraints required for real-time systems. This is where the UML Timing Diagram becomes essential.
A UML Timing Diagram is a specialized interaction diagram that focuses on the timing of state changes and message exchanges over time. It is particularly useful for embedded systems, communication protocols, and hardware-software interfaces where milliseconds matter. This guide provides a deep dive into modeling state changes and time constraints without getting lost in the details.
What Is a UML Timing Diagram? 🧭
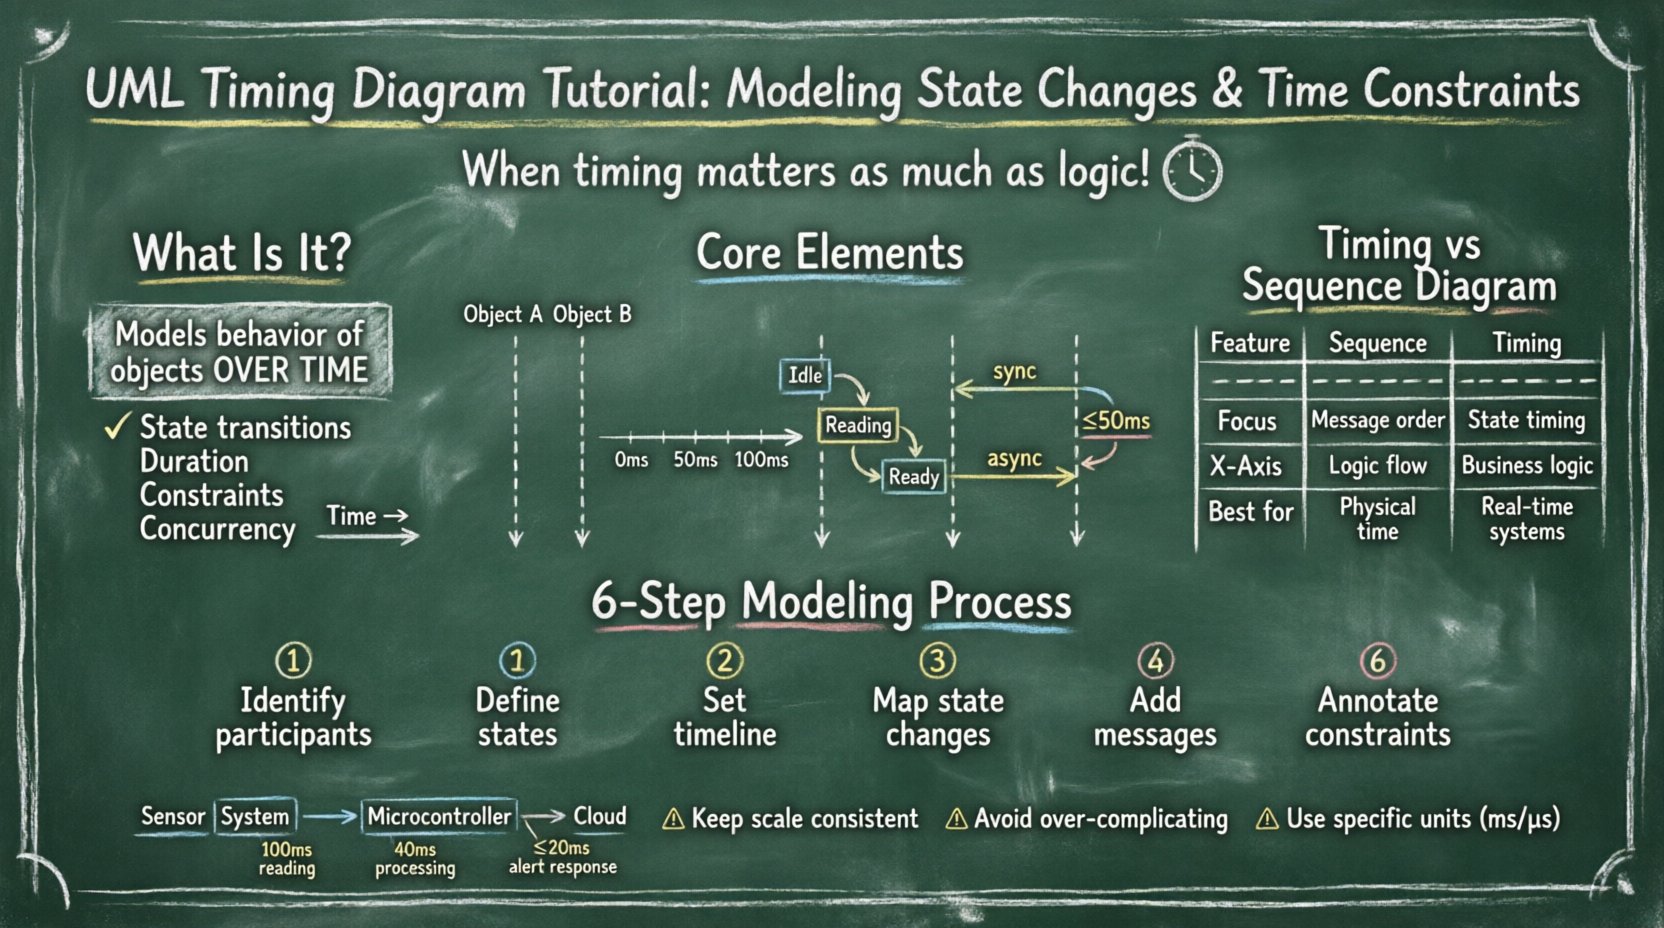
At its core, a timing diagram models the behavior of objects over time. Unlike other UML diagrams that focus on structure or static relationships, this diagram emphasizes temporal dynamics. It allows designers to visualize:
- State transitions: When an object moves from one state to another.
- Duration: How long an object remains in a specific state.
- Constraints: Deadlines, timeouts, and maximum response times.
- Concurrency: Multiple objects acting simultaneously.
While it shares the concept of lifelines with sequence diagrams, the horizontal axis in a timing diagram represents time, not interaction order. This distinction allows for precise modeling of real-time requirements.
Core Elements and Notation 📐
To build a clear and accurate diagram, you must understand the fundamental building blocks. These elements work together to represent the flow of time and state.
1. Lifelines
Lifelines represent objects, components, or actors that participate in the interaction. In a timing diagram, a lifeline is drawn as a vertical bar. It extends from the top of the diagram downwards, indicating the existence of the object throughout the modeled time period.
- Vertical Axis: Represents the object identity.
- Horizontal Extension: Represents the object’s existence over time.
2. The Time Axis
The horizontal axis is the timeline. It runs from left to right. There is no strict scale required (unlike a mathematical graph), but the relative distances between events must reflect the relative time intervals. You can annotate the axis with units (e.g., milliseconds, seconds) to clarify the scale.
3. State Specifications
State specifications are rectangular regions on the lifeline. They indicate the current state of the object during a specific time interval. The state name is written inside the rectangle.
- State Change: A vertical line crossing the state specification boundary indicates a transition.
- Duration: The width of the state box represents how long the object stays in that state.
4. Messages and Signals
Messages trigger state changes or actions. In timing diagrams, messages are drawn as arrows crossing from one lifeline to another. Unlike sequence diagrams, the exact timing of the message arrival relative to the state change is critical.
- Synchronous: The sender waits for the receiver to complete the action.
- Asynchronous: The sender continues immediately after sending.
5. Timing Constraints
Explicit constraints can be added to specify deadlines or intervals. These are often denoted by brackets or text annotations near the message or state.
- Deadline: Must occur before time T.
- Timeout: Wait for no longer than time T.
Timing Diagram vs. Sequence Diagram 🆚
Understanding when to use a timing diagram versus a sequence diagram is crucial for effective modeling. While both depict interactions, their focus differs significantly.
| Feature | Sequence Diagram | Timing Diagram |
|---|---|---|
| Primary Focus | Order of messages | Timing of state changes |
| Horizontal Axis | Logical time / Sequence | Physical time / Duration |
| State Visualization | Implicit | Explicit state boxes |
| Use Case | Business logic flow | Real-time constraints |
| Complexity | Interaction logic | Temporal logic |
If your system requires strict adherence to deadlines (e.g., a braking system in a vehicle or a packet loss handler in a network), a sequence diagram will not suffice. You need the precision of a timing diagram.
Step-by-Step Modeling Process 🛠️
Creating a timing diagram requires a structured approach to avoid confusion. Follow these steps to ensure your model remains clear and accurate.
Step 1: Identify the Participants
Start by listing the objects, components, or hardware units involved. In an embedded system, this might include a microcontroller, a sensor, and an actuator. Draw vertical lifelines for each participant.
Step 2: Define the States
For each participant, determine the relevant states. A sensor might have states like Idle, Reading, Calibrating, and Transmitting. A controller might have Waiting, Processing, and Alerting.
Step 3: Establish the Timeline
Define the starting point (usually time 0) and the duration of the scenario. Mark key milestones on the horizontal axis if specific time units are relevant.
Step 4: Map the State Changes
Draw the state rectangles on the lifelines. Ensure the width of each rectangle corresponds to the expected duration of that state. Use vertical lines to mark the exact moment a state change occurs.
Step 5: Add Messages and Triggers
Draw arrows between lifelines to show interactions. Align the message arrow with the state change it triggers. If a message arrives during a specific state, indicate that clearly.
Step 6: Annotate Constraints
Add any timing constraints. For example, if a response must happen within 50ms, annotate the message or state transition with this requirement. This highlights potential bottlenecks.
Real-World Scenario: Sensor Data Acquisition 📊
Let us apply these concepts to a practical scenario: a temperature monitoring system in an industrial environment. This scenario involves a sensor, a microcontroller, and a communication module.
The Setup
- Sensor: Measures temperature every 100ms.
- Microcontroller: Processes the data and sends it to the cloud.
- Communication Module: Handles the upload.
The Model
In this diagram, we observe the following flow:
- Time 0-100ms: The Sensor is in the Idle state. The Microcontroller is Waiting.
- Time 100ms: A trigger signal is sent to the Sensor. The Sensor transitions to Reading.
- Time 110ms: The Sensor completes the reading and transitions to Ready. It sends a data packet to the Microcontroller.
- Time 110-150ms: The Microcontroller is in Processing. It analyzes the temperature value.
- Time 150ms: If the temperature is normal, the Microcontroller transitions to Idle. If abnormal, it transitions to Alert.
- Constraint: The Microcontroller must respond to the alert within 20ms of the abnormal reading.
This example demonstrates how timing diagrams visualize not just the sequence, but the gaps and overlaps between processes. You can see that the Processing state overlaps with the Ready state of the Sensor (if the sensor is preparing the next reading), or if the system is single-threaded, how the sensor must wait.
Common Pitfalls and How to Avoid Them 🚫
Even experienced modelers can make mistakes when working with temporal data. Being aware of these common issues helps maintain diagram integrity.
1. Inconsistent Scales
One of the most frequent errors is drawing time intervals that do not reflect reality. If one state takes 10ms and another takes 100ms, the visual representation should reflect a 1:10 ratio. Inconsistent scaling makes the diagram misleading.
- Solution: Use a grid or explicit time markers on the horizontal axis.
2. Over-Complicating States
Trying to model every single state change can clutter the diagram. Not every internal calculation needs to be drawn.
- Solution: Group related internal processes into a single state box (e.g., Processing instead of Read Data + Validate + Format).
3. Ignoring Concurrency
Many systems operate in parallel. If you model everything sequentially, you miss critical race conditions.
- Solution: Ensure multiple lifelines are active simultaneously where appropriate. Use stacked messages if necessary to show parallel execution.
4. Vague Time Constraints
Using terms like Fast or Soon is not enough for engineering specifications.
- Solution: Always use specific units (ms, s, μs) and clear inequalities (≤, ≥).
Advanced Techniques for Complex Systems 🚀
As systems grow in complexity, basic timing diagrams may not be enough. Here are advanced techniques to handle intricate scenarios.
1. Nested State Machines
Complex objects often have sub-states. You can represent this by nesting smaller timing diagrams within a larger one, or by annotating the state specification with the sub-state hierarchy.
2. Timing Fragments
Similar to sequence diagrams, you can use fragments to show optional or repeated behavior. For example, a loop fragment can indicate that a sensor reading cycle repeats indefinitely.
3. Message Queues
In asynchronous systems, messages may be queued. Represent the queue as a separate lifeline or a specific region on the receiver’s lifeline to show buffering delays.
4. Jitter and Variability
Real-world systems rarely operate with perfect precision. Use dashed lines or shaded regions to indicate jitter (variation in timing) rather than solid lines for exact moments.
Integrating with Other UML Diagrams 🔗
A timing diagram does not exist in isolation. It complements other diagrams in your design documentation.
- State Machine Diagram: Use the state machine diagram to define the logic of the states. Use the timing diagram to define how long those states last.
- Component Diagram: Identify which components are involved in the lifelines of the timing diagram.
- Deployment Diagram: Map the lifelines to physical nodes (e.g., CPU, Sensor Node) to understand network latency.
This integration ensures that your temporal model aligns with your structural and logical models. Consistency across diagrams reduces ambiguity during implementation.
Best Practices for Documentation 📝
To keep your documentation effective and maintainable, adhere to these guidelines.
- Keep it Readable: If a diagram becomes too wide or complex, split it into multiple diagrams (e.g., Normal Operation vs. Error Handling).
- Use Consistent Notation: Define a legend for all symbols and line styles used.
- Version Control: Treat timing diagrams as code. Changes in timing requirements should trigger updates to the diagram and vice versa.
- Collaborate: Review diagrams with both software developers and hardware engineers. Timing requirements often sit at the intersection of these disciplines.
Conclusion 🏁
Modeling state changes and time constraints requires precision and clarity. The UML Timing Diagram provides the necessary framework to visualize these temporal dynamics without ambiguity. By focusing on lifelines, state specifications, and explicit constraints, you can ensure that your system design meets its real-time requirements.
Remember that the goal is not just to draw a diagram, but to communicate the temporal behavior of the system effectively. Avoid over-complicating the model, maintain consistent scales, and integrate the timing information with your broader architectural documentation. With these practices, you can navigate the complexities of time-sensitive systems with confidence.