When professionals discuss Unified Modeling Language (UML) diagrams, the conversation often drifts toward large-scale banking systems, telecommunications infrastructure, or massive legacy applications. It is a common misconception that UML Activity Diagrams are exclusively tools for enterprise giants with dedicated architecture teams and hefty budgets. This belief creates a barrier to entry for startups, small-to-medium enterprises (SMEs), and agile development teams who could benefit significantly from visualizing their workflows.
This guide dismantles that notion. By exploring the practical applications, structural components, and strategic advantages of activity diagrams, we will demonstrate how these visual tools serve as essential assets for clarity, communication, and efficiency regardless of organizational size. Whether you are mapping a user login flow or designing a complex data processing pipeline, the principles remain the same.
Understanding the Core Concept 🧠
An UML Activity Diagram is a behavioral diagram used to describe the dynamic aspects of a system. It represents the flow of control from activity to activity. Think of it as a sophisticated flowchart that can handle complex logic, concurrency, and decision points without becoming a tangled mess of lines. While a standard flowchart might show a linear path, an activity diagram can illustrate parallel processes, object flows, and swimlanes that define who or what performs specific actions.
The primary goal is to model the computational logic of a system. It focuses on the sequence of actions, the conditions under which actions occur, and the relationships between different parts of a process. For smaller teams, this clarity is not just a nice-to-have; it is a necessity to prevent scope creep and miscommunication.
Why the Enterprise Myth Persists 🤔
Several factors contribute to the idea that these diagrams are reserved for large corporations. Understanding these reasons helps explain why they are less visible in smaller contexts, not because they are less useful.
- Perceived Complexity: The notation can seem intimidating at first glance. The symbols for forks, joins, and object nodes are not as intuitive as a simple box-and-arrow diagram.
- Tooling Costs: Historically, professional modeling software was expensive and licensed per seat, making it a luxury for larger budgets.
- Documentation Culture: Large enterprises often have strict compliance and documentation requirements that mandate formal modeling. Small teams often prefer lightweight documentation or code-first approaches.
- Legacy Systems: Many diagrams found online are from maintaining older, monolithic systems where complex state tracking is critical.
However, the barrier is lowering. Modern tools are more accessible, and the focus has shifted toward value delivery rather than bureaucratic compliance. The underlying logic of the diagram remains valid for any system with non-trivial behavior.
Advantages for Agile and Small Teams 🛠️
Adopting this methodology offers distinct advantages for teams that move quickly. It does not slow down development; it accelerates understanding.
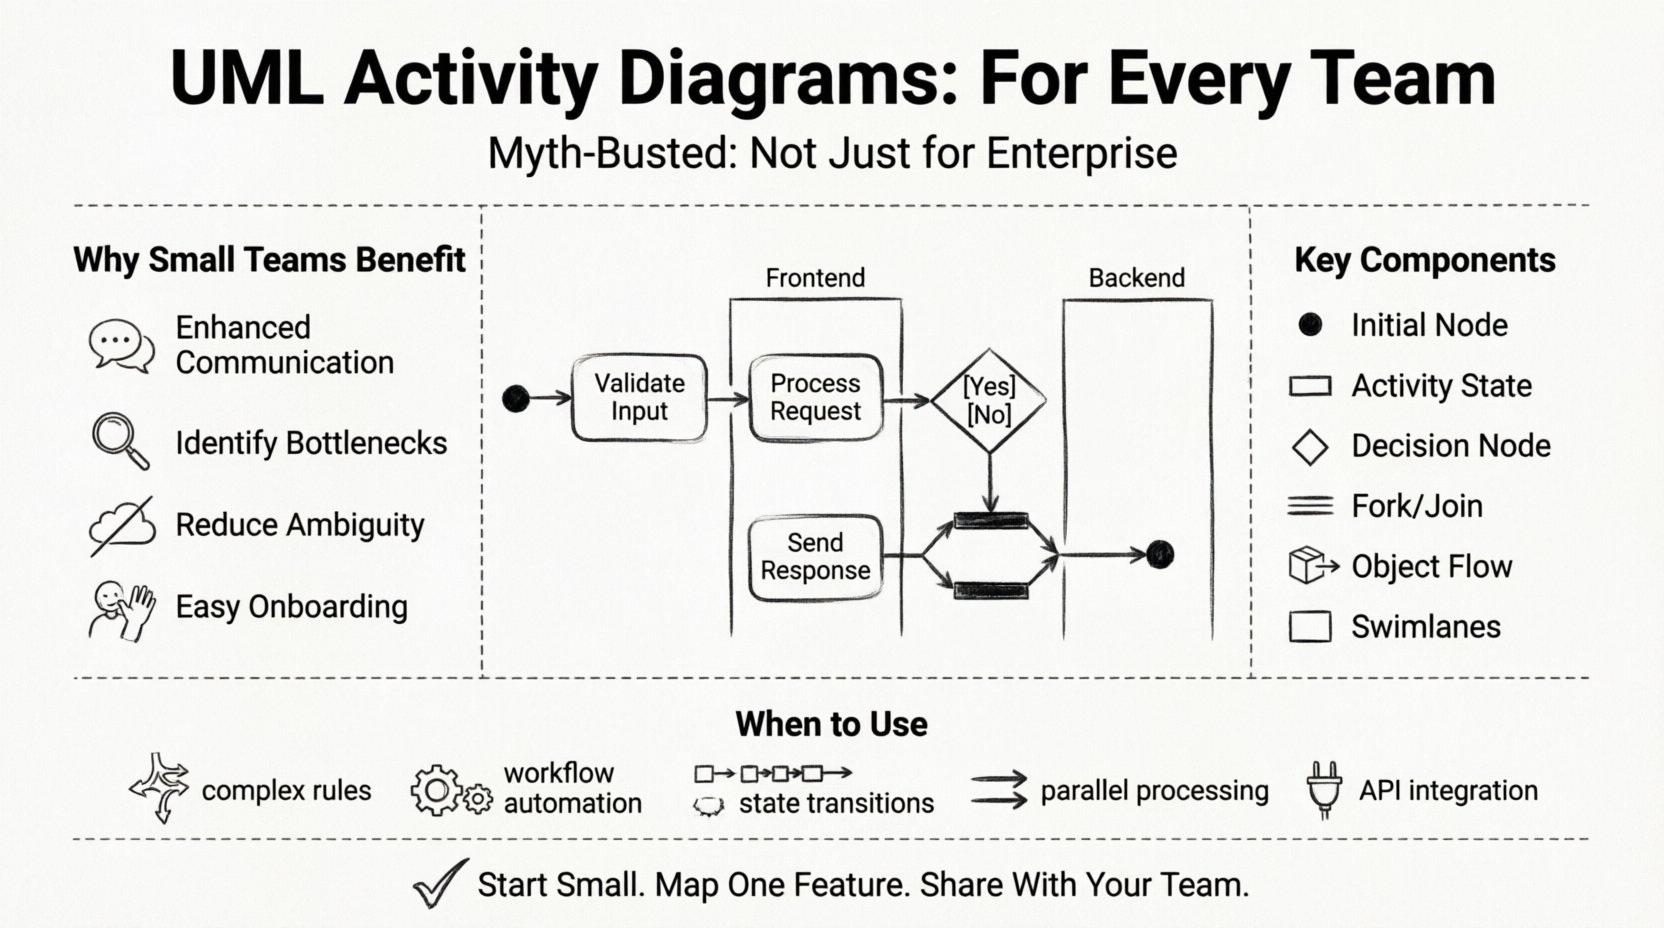
1. Enhanced Communication 🗣️
Stakeholders often struggle to understand technical specifications written in text. A visual representation bridges the gap between business requirements and technical implementation. It allows non-technical team members to verify logic before a single line of code is written.
2. Identifying Bottlenecks 🔍
When you map out a process, you can see where dependencies create delays. Swimlanes can reveal if a specific role is overloaded or if a handoff between teams creates friction. This insight is crucial for optimizing workflows.
3. Reducing Ambiguity 🚫
Verbal descriptions of logic often contain assumptions. “If the user clicks here, then something happens.” What if the network fails? What if the data is missing? Activity diagrams force the writer to define decision points and exception paths explicitly.
4. Facilitating Onboarding 👋
New team members need to understand how the system works. A diagram provides a high-level map of the application logic, serving as a quicker entry point than reading through thousands of lines of source code.
Key Components Explained 🔍
To utilize these diagrams effectively, one must understand the syntax. The notation is standardized, ensuring that anyone familiar with the basics can read the diagram regardless of the specific tool used.
Initial Node (The Start) ⏺️
This represents the beginning of the workflow. It is usually a filled black circle. Every activity diagram should have a clear starting point to avoid confusion about where the process initiates.
Activity State (The Action) ⬜
These are the rectangular boxes with rounded corners. They represent a specific action or operation. An activity can be a simple function call or a complex sub-process. They can be further decomposed into detailed diagrams if necessary.
Control Flow (The Line) ➡️
Directed arrows connect the nodes. They indicate the order of execution. The arrow points from the source action to the destination action. Control flow does not carry data; it carries the signal that an action is complete.
Decision Node (The Fork) 🔀
This is a diamond shape. It represents a point where the flow branches based on a condition. It has one incoming flow and two or more outgoing flows. Each outgoing path must be labeled with a guard condition (e.g., [True], [False], [Error]).
Fork and Join Nodes (Concurrency) 🔄
A thick horizontal bar represents a fork or join. A fork splits the control flow into parallel activities. A join merges parallel activities back into a single flow. This is essential for modeling systems that perform multiple tasks simultaneously.
Object Flow (The Data) 📦
While control flow moves the process, object flow moves data. It shows how objects are created, passed, or modified between activities. This is distinct from control flow and helps in understanding data dependencies.
Swimlanes (The Responsibility) 🏊
Swimlanes divide the diagram into sections, assigning specific activities to specific actors, roles, or system components. This clarifies ownership. If an activity sits in the “Database” lane, the database handles it. If it sits in the “Frontend” lane, the client application handles it.
When to Apply This Technique ⏱️
Not every process requires a full diagram. Over-engineering documentation can be just as harmful as having none. Use these diagrams when the logic is complex enough that text descriptions might be misinterpreted.
- Complex Business Rules: When a feature involves multiple conditional paths.
- Workflow Automation: When defining how data moves between different stages of a pipeline.
- State Transitions: When the system behavior depends heavily on its current state.
- Parallel Processing: When the system must handle multiple tasks at once.
- Integration Points: When mapping interactions between different services or APIs.
Activity Diagram vs. Other Charts 📊
Confusion often arises between activity diagrams, flowcharts, and sequence diagrams. Understanding the distinction ensures the right tool is used for the job.
| Diagram Type | Primary Focus | Best Used For |
|---|---|---|
| Flowchart | General logic and decision paths | Simple business processes, non-technical workflows |
| Sequence Diagram | Interaction between objects over time | API calls, message passing, timing of events |
| Activity Diagram | Workflow and control logic | System behavior, parallel processes, complex branching |
While a flowchart is great for a simple “If-Then” rule, an activity diagram handles concurrency and object flow better. A sequence diagram is better for showing who talks to whom, but an activity diagram is better for showing what actually happens during the process.
Building Your First Diagram 📝
Creating a diagram does not require a complex process. It follows a logical progression that can be adapted to any team size.
Step 1: Define the Scope 🎯
Identify the start and end points of the process. What triggers the activity? What is the desired outcome? Keep the scope manageable. Do not try to diagram the entire system in one view.
Step 2: Identify the Actors 🧑💻
Determine who or what performs the actions. Create swimlanes for each actor. This could be a User, a Server, a Database, or an External API.
Step 3: Map the Actions 📝
List the steps required to move from start to finish. Place them in the appropriate swimlanes. Use simple verbs for the activity states.
Step 4: Add Decision Points 🔀
Identify where the path might change. Add decision nodes for every condition that affects the flow. Ensure every decision has a defined outcome.
Step 5: Review and Refine 🔁
Walk through the diagram with the team. Check for dead ends. Ensure every path leads to a final node. Verify that the logic matches the requirements.
Common Mistakes to Avoid ⚠️
Even with the best intentions, teams can create diagrams that are difficult to maintain or read. Avoid these pitfalls to ensure longevity.
- Over-Specification: Do not include every minor detail. Focus on the high-level logic. Micro-details belong in the code comments.
- Messy Crossings: Try to minimize lines crossing each other. Use orthogonality (right-angle lines) to improve readability.
- Missing Final Nodes: Every diagram should have a clear end point. If a path disappears, it is an error.
- Ignoring Concurrency: If the system runs tasks in parallel, the diagram must reflect this with fork and join nodes. A linear diagram implies sequential execution.
- Inconsistent Notation: Stick to standard UML symbols. Mixing symbols from different standards confuses readers.
Real-World Applications Beyond Enterprise 🌍
The utility of these diagrams extends into various domains, proving their versatility.
Web Development 🌐
Mapping the user journey through a website. From landing page to checkout, activity diagrams help ensure that every button click leads to the correct state change without breaking the flow.
API Design 📡
When designing an API endpoint, an activity diagram can show the internal processing steps: validation, database query, formatting, and response sending. This helps backend developers coordinate their logic.
Data Migration 📉
Moving data from one system to another involves many steps. Cleaning, transforming, validating, and loading. An activity diagram ensures no data is lost and every step is accounted for.
DevOps Pipelines 🤖
Automated testing and deployment are complex processes. Diagramming the pipeline helps identify where a failure might occur and how to handle rollback scenarios.
Strategic Integration into Workflow 🔄
How do you keep these diagrams alive? They should not be static documents created once and forgotten. They must evolve with the code.
Living Documentation 📖
Update the diagram whenever the logic changes. If a new condition is added to a feature, the decision node must be updated. This ensures the documentation remains a source of truth.
Code Comments Linkage 🔗
Reference the diagram in the code comments. If a specific function handles a complex branch, point the developer to the relevant section of the diagram. This creates a bidirectional link between design and implementation.
Team Workshops 🤝
Use the diagram as a focal point during design reviews. Instead of discussing abstract requirements, the team can trace the lines on the diagram. This makes discussions concrete and actionable.
Final Thoughts on Accessibility 🚪
The idea that sophisticated modeling is reserved for the wealthy or the massive is a relic of the past. The value of visualizing logic is universal. For a startup, it saves time by catching errors early. For a mature team, it preserves knowledge as staff turnover occurs.
The tools to create these diagrams are more accessible than ever. The cost of learning the notation is an investment that pays dividends in reduced debugging time and clearer team alignment. By adopting this practice, smaller teams can achieve the same level of structural clarity that defines the largest systems in the world.
There is no need to wait for a large budget or a strict mandate. Start small. Pick a single feature. Map its flow. Identify the risks. Share it with the team. The process itself brings clarity, regardless of the final output.