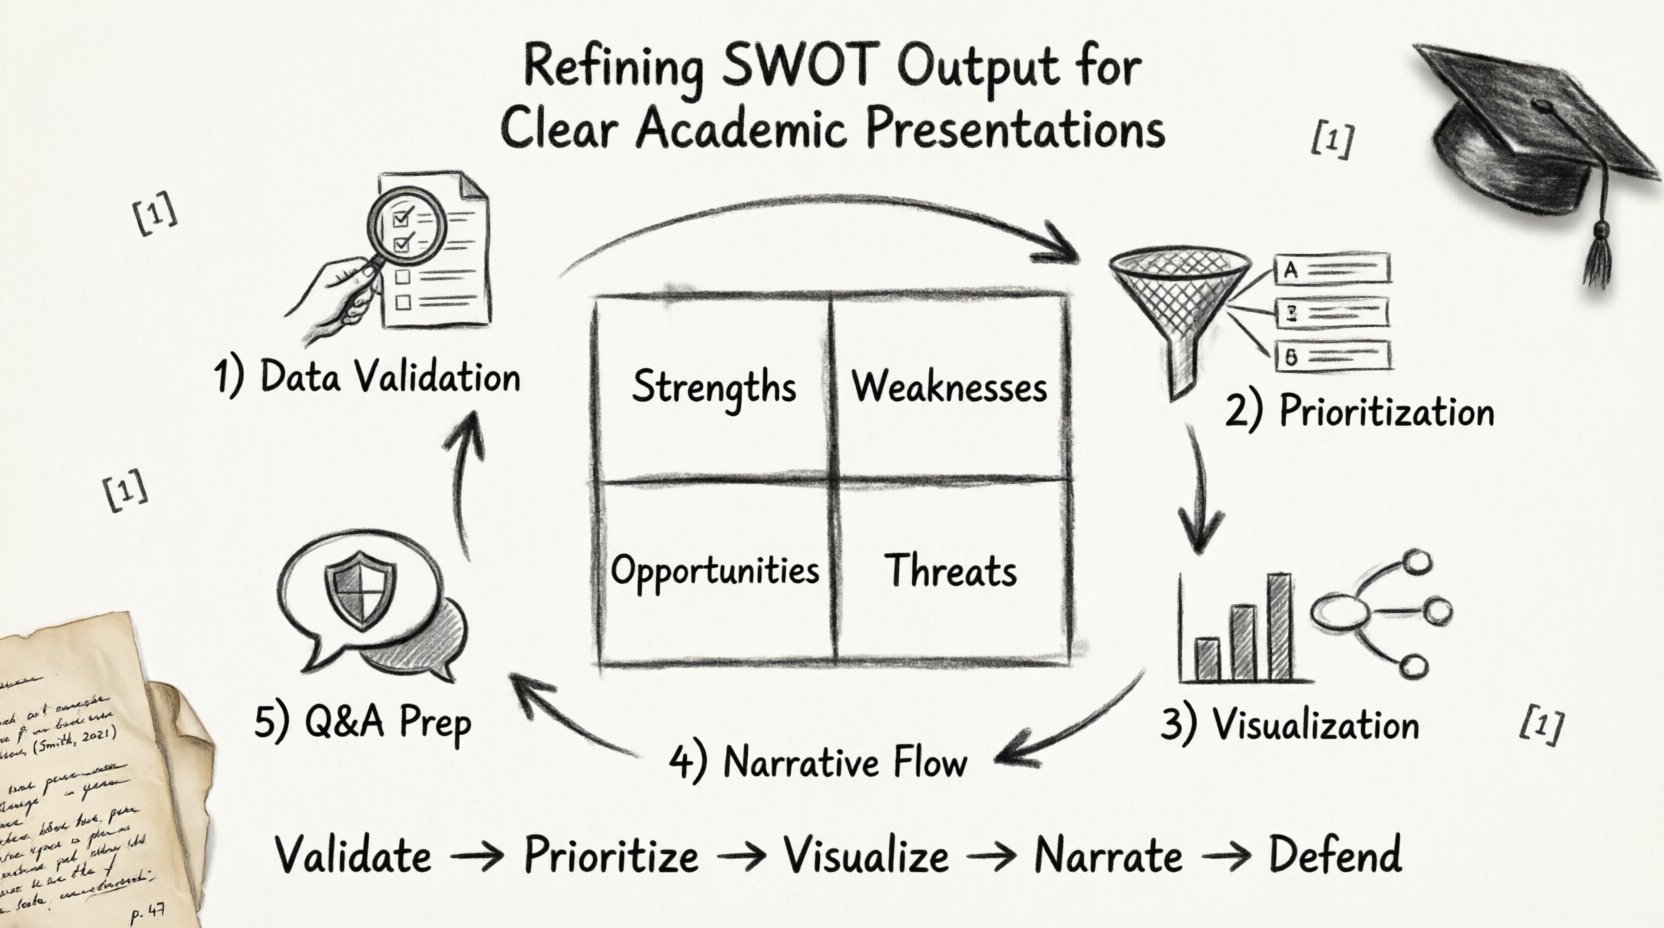
Academic research demands more than just discovery; it requires the ability to communicate findings with precision and clarity. When presenting complex data, frameworks like the SWOT analysis (Strengths, Weaknesses, Opportunities, Threats) offer a structured way to evaluate a project or hypothesis. However, raw SWOT data often lacks the nuance required for scholarly discourse. Refining this output ensures that your presentation moves beyond simple listing and evolves into a compelling narrative that withstands academic scrutiny.
This guide explores the process of transforming basic SWOT inputs into a polished, defensible presentation. We will examine data validation, visual structuring, and narrative flow without relying on specific tools or software products. The focus remains on the intellectual rigor required to present research effectively.
Understanding SWOT in an Academic Context 🧠
In the business world, SWOT is often used for competitive strategy. In academia, the purpose shifts toward critical self-evaluation and risk assessment within research parameters. A study, a thesis, or a research proposal benefits from this framework when it helps identify internal capabilities and external factors that could influence the outcome.
Before refining the output, it is essential to distinguish between a raw list and a refined analysis. A raw list might state “limited funding” as a weakness. A refined analysis explains how limited funding impacts the timeline, methodology, or scope of the study.
- Strengths: Internal attributes that support the research goals. (e.g., access to unique datasets, established methodology).
- Weaknesses: Internal limitations that hinder progress. (e.g., sample size constraints, time limitations).
- Opportunities: External conditions that could be leveraged. (e.g., emerging theories, interdisciplinary collaboration).
- Threats: External factors that could cause trouble. (e.g., ethical concerns, funding cuts).
For an academic audience, the distinction lies in the evidence supporting each point. Every claim within the SWOT matrix must be backed by data or logical deduction derived from the research context.
Step 1: Data Gathering and Validation 🔍
The foundation of a clear presentation is accurate data. Before moving to slides or charts, the information collected for the SWOT analysis must undergo a rigorous validation process. This step prevents the presentation from being dismissed due to unsubstantiated claims.
Verifying Internal Factors
Internal factors (Strengths and Weaknesses) are often subjective. To maintain academic integrity, you must quantify these factors where possible.
- Strengths: Instead of saying “strong team,” specify “team includes three experts with over ten years of combined experience in the field.”
- Weaknesses: Instead of “small budget,” quantify the variance. “The budget covers 60% of the projected material costs.”
Assessing External Conditions
External factors (Opportunities and Threats) require an environmental scan. This involves reviewing literature, policy changes, and market trends relevant to your study.
- Opportunities: Are there new grant programs? Is there a shift in public interest that aligns with your topic?
- Threats: Are there regulatory hurdles? Is the field becoming saturated with similar studies?
Validation ensures that your audience trusts the premises of your argument. If the foundation is shaky, the entire presentation loses credibility.
Step 2: Categorization and Prioritization ⚖️
A common pitfall in academic presentations is presenting too many points. A SWOT matrix often grows until it covers every conceivable aspect of a project. For a presentation, this leads to cognitive overload. You must prioritize the most impactful factors.
Filtering the Noise
Not all strengths and weaknesses are created equal. Use a scoring system to rank items based on their impact on the research outcomes.
| Factor | Impact Level | Relevance to Goal | Priority |
|---|---|---|---|
| Access to Lab Equipment | High | Critical | 1 |
| Team Availability | Medium | Important | 2 |
| Software Versioning | Low | Negligible | 4 |
In this example, software versioning is noted but ranked low. In a presentation, you might omit it entirely or mention it in passing, focusing instead on the critical equipment access.
Merging Related Points
Group similar items to reduce the visual and verbal load. If you have three distinct weaknesses related to funding, combine them into a single category: Financial Constraints. This allows for a deeper discussion on the topic rather than a superficial list.
- Before: 1. Small budget. 2. No travel funds. 3. No assistant support.
- After: Resource Limitations: Budget caps restrict travel and staffing.
Step 3: Visualizing the Output for Clarity 📊
Visual aids in academic presentations serve to reinforce understanding, not replace the speaker. When displaying SWOT data, the design must prioritize readability and logical flow. Avoid cluttered grids that force the audience to hunt for information.
Choosing the Right Format
While a standard 2×2 matrix is common, it is not always the best fit for presentations. Consider the following alternatives based on your data volume.
- Horizontal Lists: Good for short presentations where you want to emphasize the narrative flow from Strengths to Threats.
- Bar Charts: Useful if you have quantified the importance of each factor. This allows the audience to see at a glance which factors dominate.
- Mind Maps: Effective if the factors are interconnected. You can show how a specific Threat impacts a specific Strength.
Design Principles for Academic Slides
Stick to a clean, professional aesthetic. The audience should focus on the content, not the design.
- Contrast: Ensure text is legible against the background. High contrast reduces eye strain.
- Consistency: Use the same color scheme for all Strengths and the same for all Weaknesses. Consistency aids pattern recognition.
- Simplicity: Limit text per slide. Use bullet points rather than full paragraphs. You are the narrator; the slides are the visual anchors.
Step 4: Constructing the Narrative 📖
Data alone does not make a presentation. The SWOT analysis must be woven into a story that explains the research journey. This narrative connects the internal and external factors to the core research question.
Connecting the Dots
Do not present the four quadrants in isolation. Show how they interact. For example, how does a specific Strength help mitigate a Threat? This demonstrates critical thinking.
- Strategic Alignment: Explain how the Strengths are being leveraged to seize Opportunities.
- Risk Management: Detail the plan to address Weaknesses to prevent Threats from becoming critical failures.
The Problem-Solution Arc
Structure the presentation to reflect the logic of your research.
- Introduction: Define the scope and the research problem.
- Context: Introduce the SWOT analysis as a tool for understanding the environment.
- Analysis: Walk through the prioritized factors.
- Implication: What do these factors mean for the research outcome?
- Next Steps: How will you proceed given this analysis?
This structure ensures that the SWOT output is not an isolated exercise but a pivotal part of the research argument.
Step 5: Preparing for Q&A and Critique 💬
Academic presentations are rarely one-way communications. They invite scrutiny. A refined SWOT analysis prepares you for the questions that will inevitably arise from peers and reviewers.
Anticipating Challenges
Review your Weaknesses and Threats sections. These are the most likely areas to be challenged. Prepare evidence that shows you have considered these risks and have mitigation strategies in place.
- If asked about Weaknesses: Have a plan ready. “While sample size is limited, we have accounted for this by using bootstrapping methods in our statistical analysis.”
- If asked about Threats: Show contingency. “If the primary data source becomes unavailable, we have identified two secondary sources.”
Defending the Methodology
Reviewers may question why you selected certain factors over others. Be prepared to explain the criteria used for selection. This reinforces the transparency of your research process.
Common Pitfalls to Avoid 🚫
Even with a solid plan, errors can occur during the refinement process. Being aware of common mistakes helps maintain the quality of the presentation.
1. Confusing Internal and External
Ensure that factors are placed in the correct quadrant. A change in government policy is an external Threat, not an internal Weakness. Misclassification undermines the logical structure of the analysis.
2. Vague Descriptions
Phrases like “better communication” are too broad. Specify the mechanism. “Implementation of weekly sync meetings to improve data consistency.”
3. Ignoring the Audience
Do not assume the audience knows the context of your SWOT. Provide brief definitions or context for technical terms used within the analysis.
4. Over-reliance on the Matrix
Do not simply read the matrix from the slide. The audience can read faster than you can speak. Use the slide to highlight key points, and use your voice to explain the nuances.
Checklist for Final Review ✅
Before stepping up to present, run through this checklist to ensure your SWOT output is presentation-ready.
- Clarity: Are the definitions of each factor clear and unambiguous?
- Relevance: Does every point directly relate to the research goals?
- Evidence: Is there data or citations to support the claims?
- Visuals: Are the charts and tables legible from a distance?
- Narrative: Does the presentation flow logically from problem to solution?
- Timing: Does the content fit within the allotted time frame?
Summary of Best Practices 📝
Refining SWOT output for academic presentations is an exercise in clarity and rigor. It requires moving beyond a simple checklist to a strategic evaluation of your research environment. By validating data, prioritizing factors, designing clear visuals, and constructing a strong narrative, you transform a basic framework into a powerful communication tool.
The goal is not to make the presentation look impressive, but to make the research understandable and defensible. When you present with confidence and precision, you honor the work that went into the study. This approach respects the audience’s intelligence and strengthens the academic discourse surrounding your findings.
Remember that the SWOT analysis is a means to an end. It supports the research, it does not replace it. Use it to illuminate the path forward, ensuring that your presentation remains focused on the contribution of your work to the field.