


Strategic planning often begins with a familiar framework. The SWOT analysis stands as a cornerstone for organizations seeking clarity. It breaks down internal capabilities and external conditions into four distinct quadrants. Strengths, Weaknesses, Opportunities, and Threats. It is a tool that many teams reach for when starting a project or evaluating a business unit.
However, a common pitfall exists in how this tool is applied. Too often, the output is merely a list. A static inventory of items separated by category. While listing is a necessary first step, it is not the strategy itself. True strategic value lies in the interconnections between these elements. This article explores how to move past simple enumeration and analyze the dynamic relationships that drive decision-making.
🛑 Why Listing Isn’t Strategy
When a team produces a SWOT document, the immediate reaction is often satisfaction. They have filled the four boxes. They feel prepared. Yet, this satisfaction can be misleading. A list implies that items within a category exist in isolation. It suggests that a Strength is simply a positive attribute, regardless of context.
Real-world strategy is rarely isolated. Factors interact. They influence one another. A strength that is irrelevant to the current market is not a strength. A threat that cannot be mitigated by existing capabilities is a critical vulnerability. Relying solely on a list ignores these nuances.
- Static Nature: Lists do not change based on new data unless manually updated.
- Missing Context: It does not explain why a strength matters.
- Lack of Actionability: Knowing you have a weakness does not tell you how to fix it.
- False Security: Teams may feel they have analyzed the situation when they have only categorized it.
To build a robust plan, we must look at how these factors connect. We must ask how an internal attribute impacts an external condition. This shift in perspective transforms a checklist into a strategic map.
🔗 Understanding Interconnections
Interconnections refer to the causal links between internal factors (Strengths and Weaknesses) and external factors (Opportunities and Threats). Analyzing these links allows leaders to understand the mechanics of their competitive position.
Consider the relationship between a Weakness and a Threat. If a company lacks technical expertise (Weakness) and faces a competitor with superior technology (Threat), the risk is compounded. The Weakness makes the Threat more dangerous. Conversely, if a company has a strong brand (Strength) and faces a market downturn (Threat), the brand may provide a buffer. The Strength mitigates the Threat.
Similarly, look at Strengths and Opportunities. A new market opening (Opportunity) can only be captured if the organization has the capacity to seize it (Strength). If the Strength aligns with the Opportunity, growth is possible. If the Strength does not align, the Opportunity remains theoretical.
📊 Internal vs. External Dynamics
To analyze these connections effectively, one must distinguish between what can be controlled and what must be navigated. This distinction guides the analysis of interconnections.
| Factor Type | Category | Control Level | Strategic Focus |
|---|---|---|---|
| Internal | Strengths | High | Leverage and Maximize |
| Internal | Weaknesses | High | Remediate and Minimize |
| External | Opportunities | Low | Exploit and Capture |
| External | Threats | Low | Defend and Mitigate |
Understanding this table clarifies where to direct effort. You cannot change the weather, but you can adjust your sails. You cannot change the market, but you can improve your product. The interconnections determine which sails to adjust for which winds.
🧩 The TOWS Matrix Framework
The TOWS Matrix is the primary tool used to analyze these interconnections. It is named after the acronym but functions differently than the standard SWOT. It actively pairs factors to generate strategies. It forces the team to look at the cross-connections rather than the vertical columns.
There are four distinct strategy types derived from these pairings:
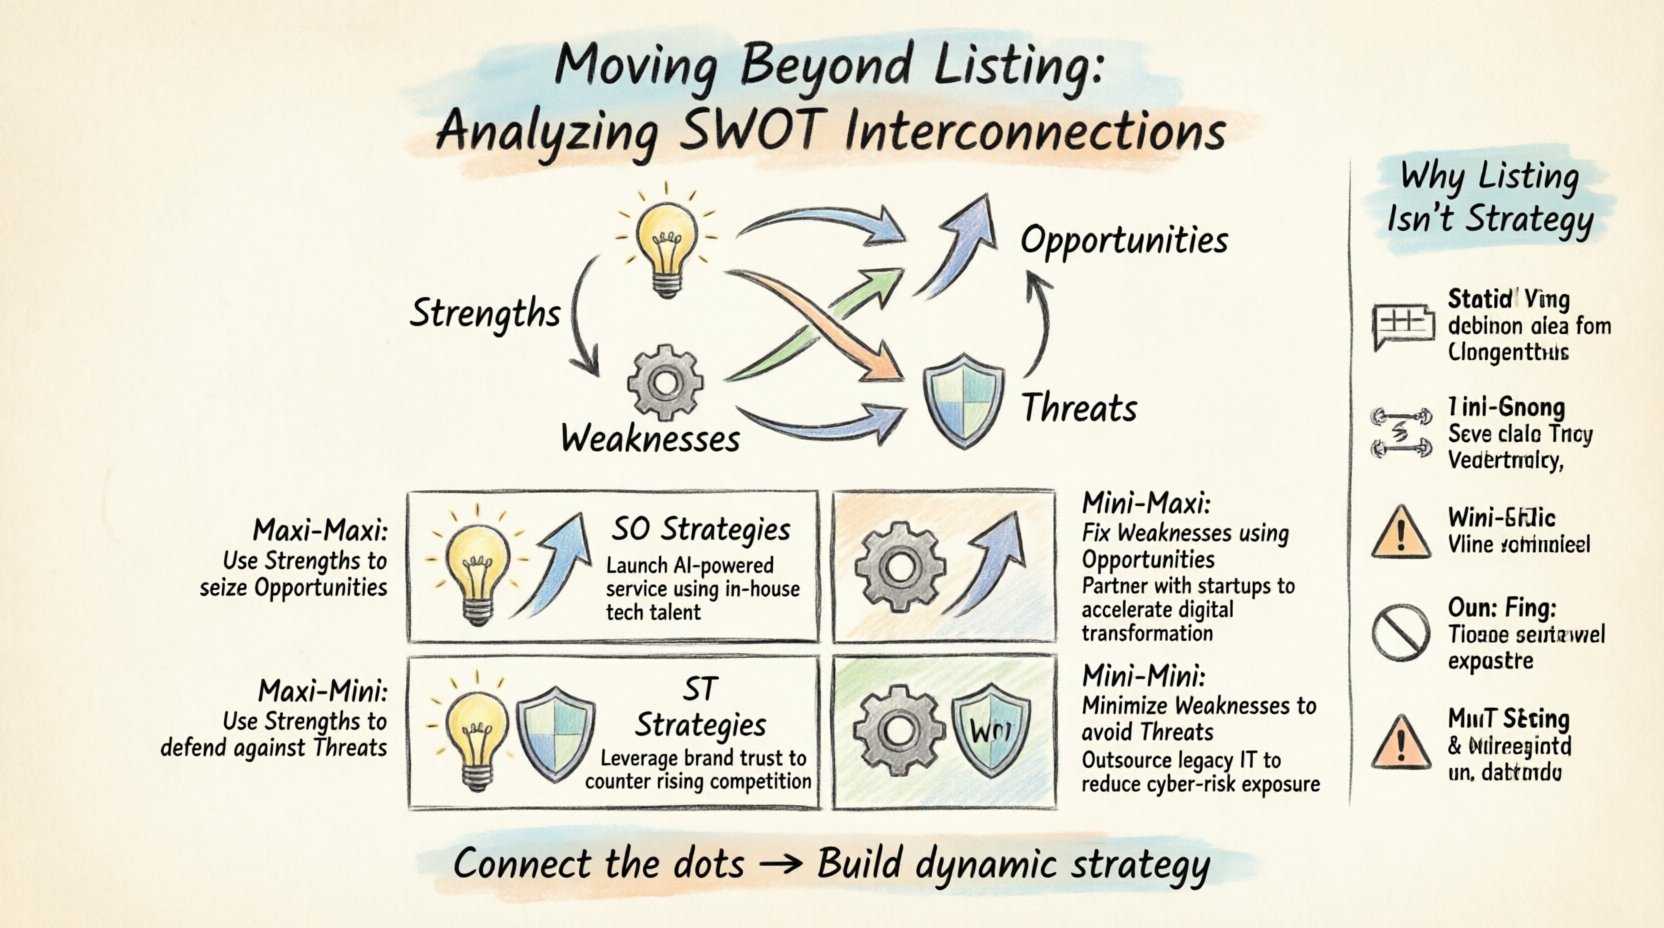
1. SO Strategies (Maxi-Maxi)
Goal: Use Strengths to maximize Opportunities.
- Logic: What can we do to take advantage of our strengths to capture external growth?
- Action: Aggressive expansion, product development, market penetration.
- Example: Using a robust distribution network (Strength) to enter a new geographic region (Opportunity).
2. WO Strategies (Mini-Maxi)
Goal: Overcome Weaknesses by taking advantage of Opportunities.
- Logic: How can external trends help fix internal problems?
- Action: Partnerships, outsourcing, acquiring new technology.
- Example: Partnering with a tech firm (Opportunity) to fill a skills gap (Weakness).
3. ST Strategies (Maxi-Mini)
Goal: Use Strengths to minimize Threats.
- Logic: How can we use our advantages to reduce the impact of external risks?
- Action: Defensive marketing, diversification, cost leadership.
- Example: Using cash reserves (Strength) to survive a price war (Threat).
4. WT Strategies (Mini-Mini)
Goal: Minimize Weaknesses to avoid Threats.
- Logic: What actions are necessary to prevent failure when both internal and external factors are negative?
- Action: Retrenchment, divestment, cost-cutting, survival mode.
- Example: Exiting a failing product line (Weakness) to avoid regulatory fines (Threat).
📝 Practical Framework for Analysis
Implementing this interconnection analysis requires a structured approach. It is not enough to brainstorm randomly. The process must be rigorous to ensure the insights are actionable.
- Data Collection: Gather information from diverse sources. Sales data, customer feedback, market research, and financial reports. Ensure the data is current.
- Validation: Review the initial list of SWOT factors. Are they specific? Are they evidence-based? Remove vague items like “good reputation” and replace them with “high Net Promoter Score.”
- Pairing: Create the TOWS matrix. Force connections between every relevant item. If an item does not connect to anything else, it may be a distraction.
- Prioritization: Not all connections are equal. Use a scoring system to rank strategies based on impact and feasibility.
- Resource Mapping: Assign resources to the top strategies. Identify what is needed to execute the SO strategies versus the WT strategies.
- Review Cycle: Set a schedule to revisit the analysis. Market conditions shift, and so should the interconnections.
⚠️ Common Analytical Pitfalls
Even with a framework, teams can make errors. Recognizing these pitfalls helps maintain the integrity of the analysis.
- Confusing Symptoms with Causes: “Low sales” is a symptom, not a Strength or Weakness. The Weakness might be “poor pricing strategy.”
- Internal Bias: Overestimating Strengths due to internal pride. Be objective and seek external feedback.
- Ignoring Dependencies: Assuming a Strength exists without the resources to support it. A skilled team is a strength only if they have the tools to work.
- Static Thinking: Treating the analysis as a one-time event. Strategy is a continuous loop.
- Too Many Items: A list with 50 items is useless. Focus on the top 5 to 10 critical factors in each quadrant.
📈 Resource Allocation Based on Insights
Once the interconnections are clear, the next step is budgeting and staffing. Strategy is meaningless without the resources to back it up. The TOWS analysis informs where to invest.
Investment in SO Strategies: These should receive the highest priority funding. They represent the path to growth. If you have a clear path to capture market share, you must fund it adequately.
Investment in WO Strategies: These often require capital to fix internal issues. This might mean training programs, new software, or hiring consultants. The goal is to remove barriers to growth.
Investment in ST Strategies: These are defensive. They protect the current revenue stream. Do not underfund these, but do not overinvest either. The goal is stability.
Investment in WT Strategies: These often involve reducing investment. Divesting from underperforming areas to free up resources for SO strategies. It is difficult to cut losses, but necessary for long-term health.
🌐 Measuring Strategic Impact
How do you know if the analysis of interconnections is working? You need metrics that track the relationship between your actions and the factors you identified.
- Market Share Growth: Did the SO strategies increase your footprint?
- Operational Efficiency: Did the WO strategies reduce internal friction?
- Risk Exposure: Did the ST strategies reduce the frequency of security incidents or market volatility impact?
- Cost Reduction: Did the WT strategies improve the margin or reduce burn rate?
These metrics should be tracked regularly. If a strategy is not yielding results, revisit the interconnection. Perhaps the link was incorrect. Perhaps the external factor changed. The analysis must be agile.
💡 Final Thoughts
The shift from listing to analyzing interconnections is a shift from administration to leadership. A list is a record of the past. An analysis of connections is a blueprint for the future.
By understanding how your strengths enable opportunities, or how your weaknesses amplify threats, you gain a clearer picture of your strategic reality. This depth allows for better resource allocation and more resilient planning.
Do not settle for the convenience of a simple table. Challenge the connections. Test the assumptions. Ensure that every item on your list has a role in the broader strategy. This rigorous approach ensures that your planning process yields tangible results rather than just documentation.
Adopt the TOWS mindset. Connect the dots. Build a strategy that is dynamic, responsive, and grounded in the reality of your operational environment.