


Modeling concurrent systems requires precision. When a developer moves beyond simple linear execution flows, the complexity of time becomes the primary variable. The Unified Modeling Language (UML) provides a specific artifact for this: the Timing Diagram. While Sequence Diagrams offer a high-level view of interaction order, Timing Diagrams drill down into the temporal relationships between events. This level of detail is critical for mid-level developers who are tasked with designing robust, real-time, or embedded systems.
A well-constructed timing diagram prevents race conditions, clarifies state transitions, and documents the exact timing constraints required for system stability. However, creating these diagrams introduces specific notations and rules that differ significantly from other UML artifacts. This guide outlines the 10 essential elements every mid-level developer must include to ensure clarity and accuracy in their software design documentation.
📊 Understanding the Context: Why Timing Diagrams Matter
Before diving into the checklist, it is necessary to understand the specific niche a Timing Diagram fills. In software architecture, there is often confusion between Sequence Diagrams and Timing Diagrams. Both depict interactions between objects or components. The distinction lies in the X-axis representation.
- Sequence Diagrams: Focus on the order of messages. The X-axis represents time implicitly, but the scale is not explicit. Gaps between lines do not necessarily denote specific durations.
- Timing Diagrams: Focus on the actual duration of states and the timing of events. The X-axis is a specific time scale. A gap between events represents a measurable interval.
For mid-level developers, this distinction is vital. If you are documenting a system where a timeout of 500 milliseconds is critical, or where two threads must synchronize within a specific window, a Sequence Diagram is insufficient. The Timing Diagram provides the necessary granularity to validate system performance requirements before code is written.
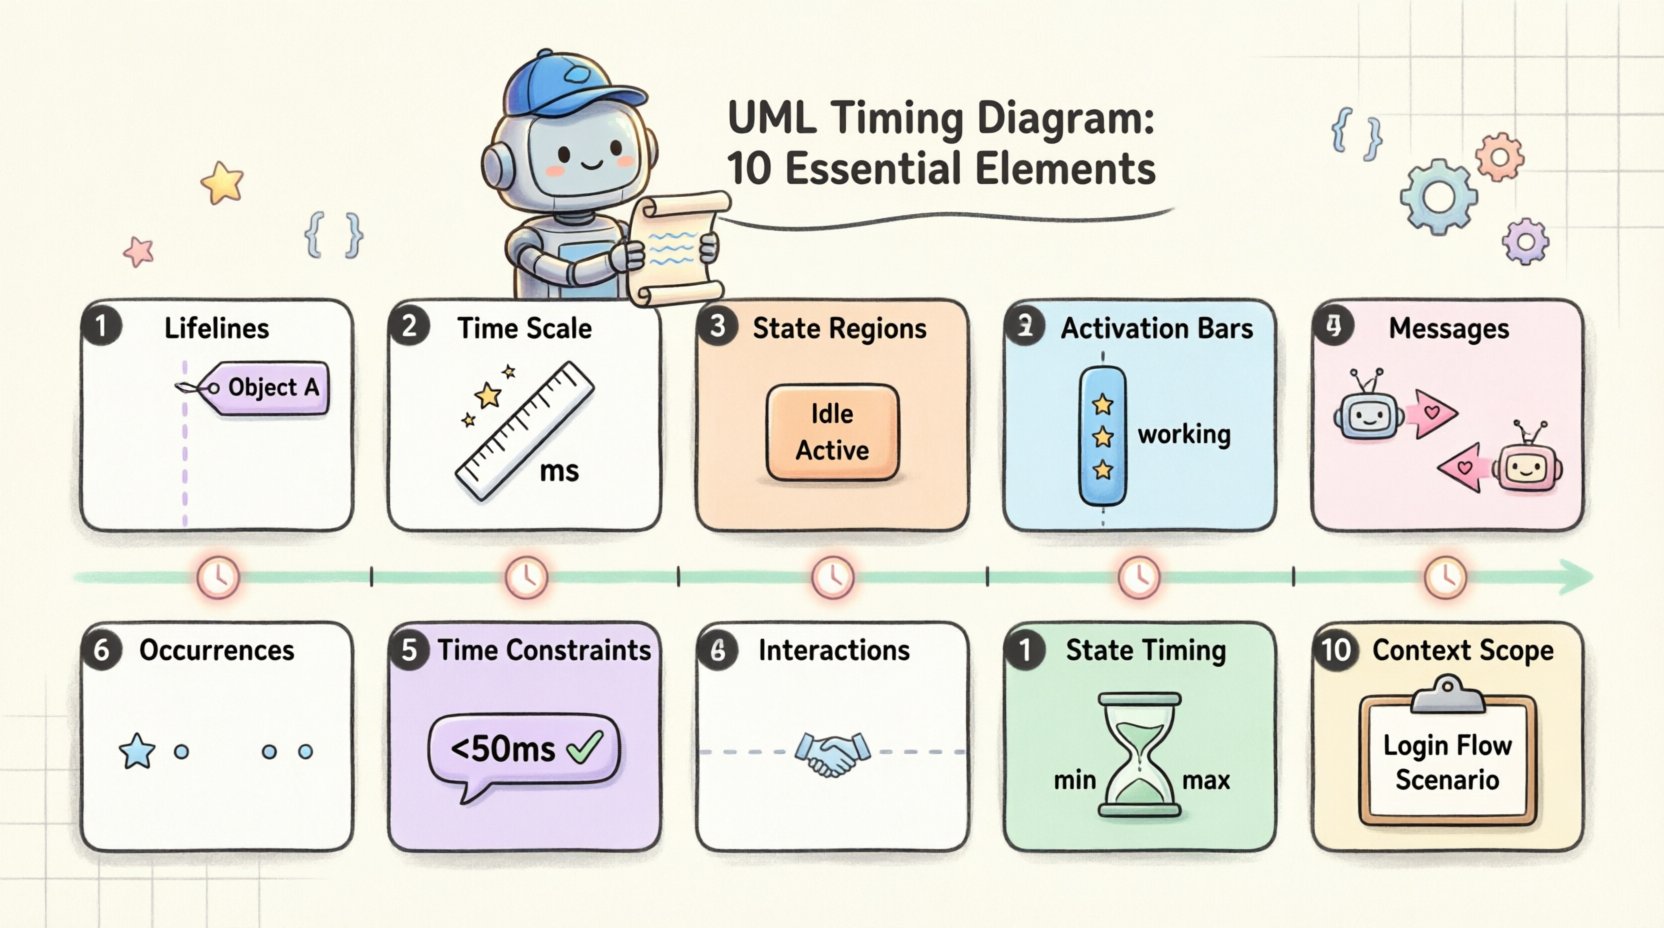
🛠️ The 10 Essential Elements Checklist
To build a functional and readable Timing Diagram, specific components must be present. Omitting any of these can lead to ambiguity, misinterpretation by stakeholders, or implementation errors. Below are the 10 elements required for a complete specification.
1. Lifelines (Participants)
The foundation of any UML interaction diagram is the lifeline. In a Timing Diagram, a lifeline represents a specific participant in the system. This could be a software class, a hardware component, a thread, or an external system.
- Visual Representation: Typically drawn as a vertical line extending downwards.
- Labeling: The lifeline must be clearly labeled at the top. Use the fully qualified name of the class or component.
- Scope: Ensure the lifeline covers the entire duration of the scenario being modeled. If a component is inactive during the window, the line still exists, but the state representation changes.
Without clear lifelines, it is impossible to determine which component is reacting to which event. This element is often overlooked when focusing too much on the messages, leading to confusion about ownership of state changes.
2. Time Scale (X-Axis)
The defining feature of a Timing Diagram is the horizontal time axis. Unlike a Sequence Diagram where time flows down the page, here time flows from left to right.
- Units: The scale must specify units (e.g., milliseconds, seconds, clock cycles). Do not assume the reader knows the unit.
- Markings: Include tick marks at regular intervals. This allows the reader to estimate the duration of specific states or delays.
- Direction: Ensure the arrow on the axis points to the right, indicating forward time.
A missing or ambiguous time scale renders the diagram useless for timing analysis. If the diagram is meant to show “eventual consistency,” the scale might be abstract. However, for real-time systems, the scale is the most critical element of the document.
3. State Representations (Regions)
Timing Diagrams excel at showing the state of a lifeline over time. Instead of just showing messages, you show the state of the object. This is often done using a rectangular box (region) drawn over the lifeline.
- State Naming: Clearly label the state within the region (e.g., “Idle”, “Processing”, “Waiting”).
- Transitions: Use vertical lines or specific markers to indicate when the state changes from one region to another.
- Value Changes: For complex objects, you might need to show the change of a specific variable value over time within the region.
State representation allows developers to visualize the lifecycle of an object without needing to trace a long chain of messages. It simplifies complex logic into visual blocks of time.
4. Activation Bars (Focus of Control)
Activation bars (or focus of control) indicate when an object is actively performing an operation or is in the middle of a process. This is distinct from a state; an activation bar indicates work is happening.
- Placement: Drawn as a thin rectangle on the lifeline.
- Duration: The length of the bar corresponds to the duration of the operation.
- Nesting: If an operation triggers another operation within the same object, nested activation bars can be used to show recursion or internal calls.
Confusing activation bars with state regions is a common error. Activation bars imply activity; state regions imply status. Both are necessary for a complete picture of concurrent behavior.
5. Messages and Signals
Messages are the triggers that cause changes in states or activations. In a Timing Diagram, these are drawn as horizontal arrows connecting lifelines.
- Alignment: The arrow must align with the exact time point on the X-axis where the message is sent.
- Type: Distinguish between synchronous calls (solid arrowhead), asynchronous signals (open arrowhead), and return values (dashed line).
- Labeling: Every message should have a name and, if applicable, parameters.
The alignment of the message is the most crucial aspect of a Timing Diagram. A message sent at 100ms is different from one sent at 105ms. Precision here is non-negotiable.
6. Occurrences
Occurrences represent the actual realization of a message or event. They are often depicted as small circles or specific markers on the lifeline.
- Timing Points: These mark the precise moment a signal is received or an event occurs.
- Frequency: If a system polls a sensor, occurrences show the regular intervals of these polls.
Occurrences help distinguish between the sending of a message and the actual processing of it. They are essential for debugging latency issues.
7. Time Constraints (Text Constraints)
Not all timing requirements can be drawn. Sometimes, a specific constraint must be documented explicitly using text.
- Notation: Use the UML stereotype notation `«constraint»` or standard text annotations.
- Examples: “Response time must be < 50ms”, “Timeout period is 5s”.
- Placement: Place these near the relevant lifeline or message to avoid ambiguity.
These constraints act as the contract between the design and the implementation. They define the boundaries within which the system must operate.
8. Interactions and Dependencies
Complex systems involve multiple lifelines interacting. The connections between these lifelines must be explicit.
- Dependency Lines: Show which components rely on others for timing.
- Grouping: Use combined fragments (like `alt` or `opt`) if the timing depends on a condition, though this is less common in pure timing diagrams than sequence diagrams.
Clear interaction lines prevent the diagram from becoming a spaghetti chart. If a lifeline interacts with three others, the paths must be distinct.
9. Timing Constraints on States
Just as messages have timing, states can have duration constraints. A state might need to persist for a minimum amount of time.
- Min/Max: Specify minimum or maximum durations for a state.
- Validity: Indicate if a state is valid only for a specific window.
This is critical for systems that require debouncing inputs or holding a resource for a specific period. It documents the temporal rules of the state machine.
10. Context and Scope
Finally, the diagram must define its boundaries. What scenario is this modeling?
- Scenario Title: Every diagram should have a clear title describing the scenario (e.g., “User Login Timeout Flow”).
- Preconditions: State what must be true before this timing diagram is valid.
- Scope: Define which part of the system is included. Excluding irrelevant components reduces noise.
Without context, a Timing Diagram is just a collection of lines. The context tells the reader why this specific timeline matters.
📋 Comparison: Timing vs. Sequence Diagrams
To ensure you are using the correct tool for the job, consider the differences outlined below.
| Feature | Timing Diagram | Sequence Diagram |
|---|---|---|
| Primary Focus | Time duration and state changes | Order of messages |
| X-Axis | Explicit Time Scale | Implicit Time |
| State Visibility | High (Rectangles over lifelines) | Low (Focus on objects) |
| Best Use Case | Real-time, concurrency, timeouts | Logic flow, API interactions |
| Complexity | High (Requires precision) | Medium (Requires clarity) |
⚠️ Common Pitfalls and Best Practices
Even with the 10 elements checklist, errors can occur. Mid-level developers often struggle with specific nuances in timing diagrams. Below are common mistakes and how to avoid them.
Pitfall 1: Ignoring Clock Drift
In distributed systems, clocks are never perfectly synchronized. A Timing Diagram often assumes a single global clock. If you are modeling a distributed system, you must acknowledge that the X-axis represents logical time, not necessarily physical clock time for every node.
Pitfall 2: Overcrowding the Axis
Trying to show every microsecond of a system’s operation can make the diagram unreadable. Use zoomed-in views for critical sections and zoomed-out views for general flow. Do not force a single diagram to cover the entire lifecycle of the application.
Pitfall 3: Mixing Levels of Abstraction
Do not mix hardware timing (nanoseconds) with software logic (milliseconds) in the same diagram unless necessary. Keep the units consistent to avoid confusion.
Best Practice 1: Use Standard Notation
Stick to the UML 2.5 standard for timing diagrams. Deviating from standard shapes (like using circles for messages instead of arrows) will confuse readers familiar with the standard.
Best Practice 2: Version Control
Timing diagrams evolve as the system changes. Treat them as code. Store them in version control. A change in a timeout value in the diagram should trigger a code review.
Best Practice 3: Collaboration
Review timing diagrams with the hardware team if you are working on embedded systems. They can verify if the time scales match the actual hardware capabilities.
🧩 Integrating with Other Artifacts
A Timing Diagram does not exist in isolation. It is part of a larger modeling ecosystem.
- State Machine Diagrams: Use Timing Diagrams to validate the timing of transitions defined in State Machine Diagrams.
- Sequence Diagrams: Use Timing Diagrams to elaborate on complex sequences where timing is a constraint.
- Deployment Diagrams: Ensure the timing constraints align with the network latency between deployed components.
By linking these artifacts, you create a cohesive design document that covers logic, structure, and time.
🔍 Final Review of the Checklist
Before finalizing your documentation, run through this quick audit.
- ☐ Are all lifelines labeled correctly?
- ☐ Is the time scale explicit with units?
- ☐ Are state regions clearly defined?
- ☐ Do activation bars show correct duration?
- ☐ Are messages aligned with the time axis?
- ☐ Are occurrences marked where needed?
- ☐ Are text constraints included for complex rules?
- ☐ Are interactions between lifelines clear?
- ☐ Are state timing constraints documented?
- ☐ Is the scenario context defined?
Completing this checklist ensures that the diagram is not just a drawing, but a specification that can be used to verify system behavior. It bridges the gap between high-level design and low-level implementation details.
🛠️ Implementation Considerations
When moving from design to development, these diagrams serve as a reference for testing. Automated test suites can be configured to check if the system adheres to the timing constraints defined in the diagram. This is known as timing-based testing.
Developers should also consider the performance implications. If a diagram specifies a response time of 10ms, the implementation must be optimized to meet this. If the current architecture cannot support this, the diagram serves as the evidence to request a redesign.
This feedback loop between design and implementation is where the value of the Timing Diagram truly lies. It is not just documentation; it is a validation tool.
📝 Summary of Key Takeaways
UML Timing Diagrams are specialized tools for modeling time-dependent behavior. They are essential for mid-level developers working on concurrent, real-time, or performance-critical systems. The 10 elements outlined above form the backbone of a valid diagram.
By paying attention to the lifelines, the time scale, the state regions, and the precise alignment of messages, developers can create specifications that reduce ambiguity. Avoiding common pitfalls like mixing abstraction levels or ignoring clock drift ensures the diagram remains accurate.
When integrated with other UML artifacts and used as a basis for testing, the Timing Diagram becomes a powerful asset in the software development lifecycle. It transforms abstract requirements into concrete, measurable constraints.
Adopting this structured approach to timing documentation improves communication between architects, developers, and testers. It ensures that everyone shares a common understanding of the system’s temporal behavior. This clarity is the foundation of reliable software.