


In the complex world of software engineering and system analysis, clarity is king. When developers, stakeholders, and designers need to understand the flow of a process, a visual representation is often the only way to ensure everyone is on the same page. This is where the Unified Modeling Language (UML) shines, specifically through the UML activity diagram. These diagrams provide a dynamic view of a system, capturing the flow of control from one activity to another. Whether you are designing a new feature or documenting an existing legacy process, knowing how to draw a UML activity diagram is an essential skill.
This guide will walk you through the entire process of creating your first activity diagram. We will explore the core symbols, the logic behind the flows, and the best practices for maintaining readability. You do not need a specific tool to start; you simply need a canvas and an understanding of the logic. Let us dive into the mechanics of process modeling.
What is a UML Activity Diagram? 📊
An activity diagram is a behavioral diagram that shows the dynamic nature of a system. It is essentially a flowchart designed for software modeling, but with specific notations that distinguish it from standard flowcharts. While a flowchart might show logic for a program, an activity diagram shows the workflow of business processes or the sequence of actions within a system.
Think of it as a map for a journey. It tells you where you start, the decisions you make along the way, the actions you take, and where you eventually finish. It is particularly useful for:
- Visualizing Workflows: Mapping out how data moves through a system.
- Identifying Bottlenecks: Seeing where processes get stuck or wait.
- Parallel Processing: Showing where multiple tasks can happen at the same time.
- Documentation: Providing a clear reference for future developers.
Unlike a class diagram which shows structure, or a sequence diagram which shows interactions over time, an activity diagram focuses on the behavior and the logic of the system. It bridges the gap between high-level business requirements and low-level technical implementation.
Core Elements and Notations 🔍
To draw a diagram effectively, you must understand the vocabulary of the notation. Each shape has a specific meaning, and using them correctly ensures that anyone reading your diagram understands your intent. Below is a breakdown of the fundamental building blocks you will use.
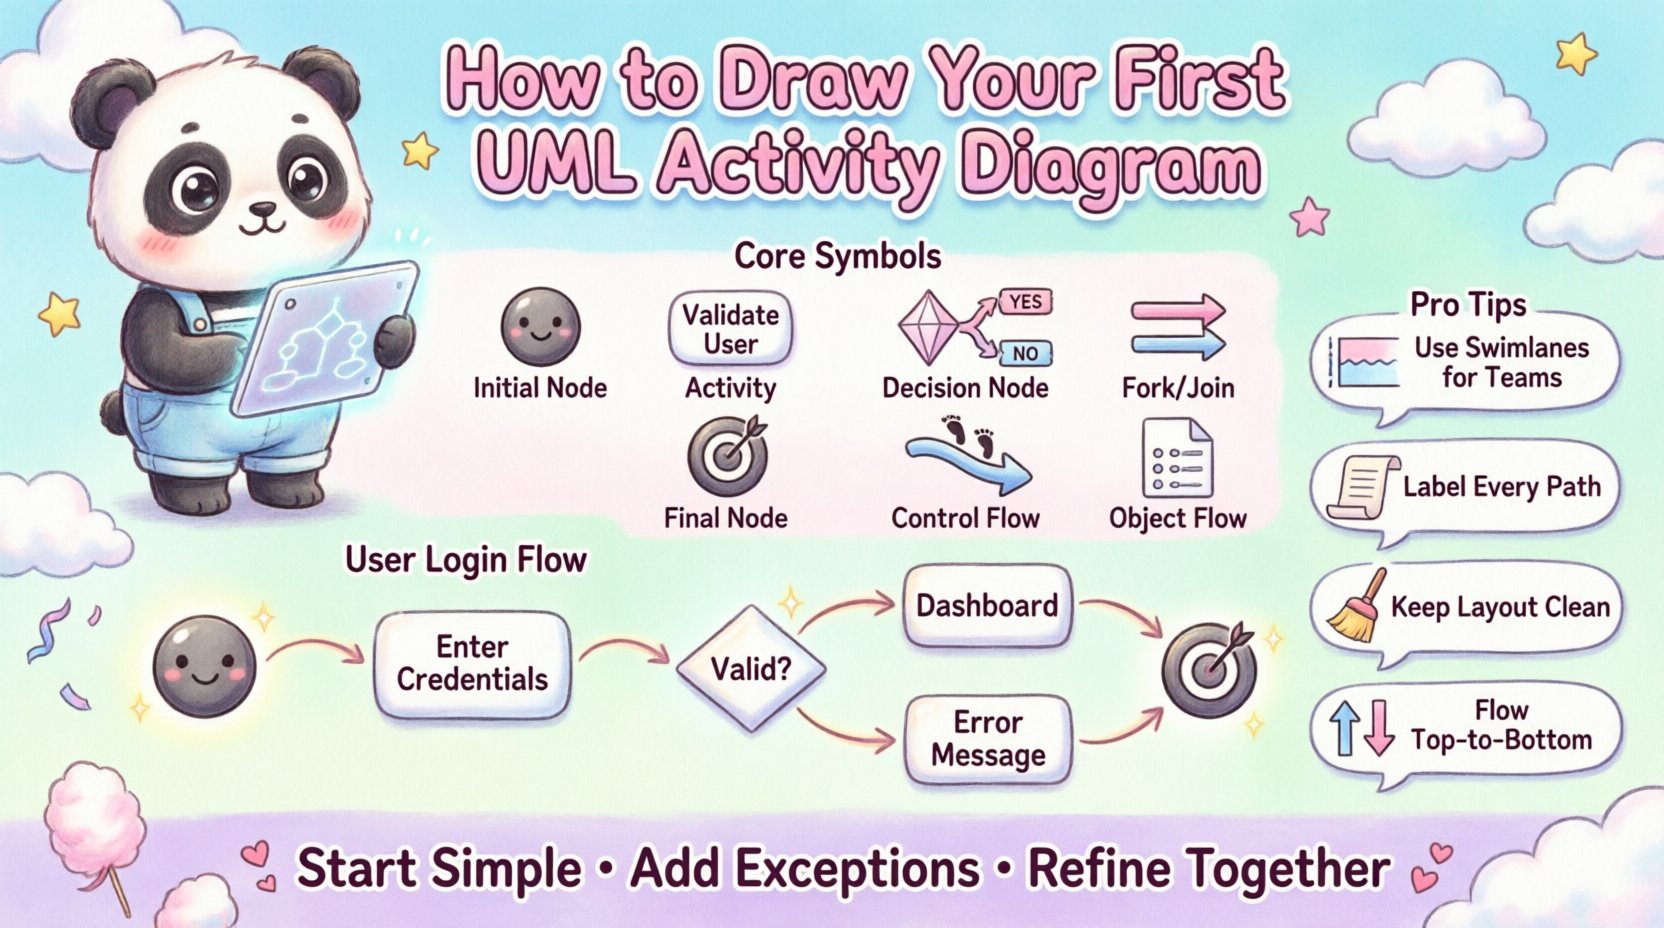
| Symbol | Name | Purpose |
|---|---|---|
| ● | Initial Node | Start point of the activity flow. |
| ⬜ | Activity (Action) | A step or task being performed. |
| ⬦ | Decision Node | A point where the flow branches based on a condition. |
| ▬ | Fork / Join Node | Splits or merges concurrent flows. |
| ⦿ | Final Node | End point of the activity flow. |
| ⬚ | Control Flow | Arrow showing the direction of flow. |
| 📄 | Object Flow | Shows data moving between activities. |
Let us expand on these elements to ensure you have a deep understanding of how they function together.
1. The Initial and Final Nodes
Every diagram needs a beginning and an end. The Initial Node is a solid black circle. It signifies the moment the process is triggered. There should typically be only one initial node per diagram to avoid confusion about where the logic starts. Conversely, the Final Node is a circle with a dot inside. It indicates that the process has completed successfully. Sometimes, a process might have multiple final nodes if it can end in different states (e.g., successful payment vs. failed payment).
2. Activities and Actions
The rectangle is the workhorse of the diagram. It represents an action, a task, or a step in the process. Inside the rectangle, you write a verb or a verb phrase, such as “Validate User” or “Process Payment.” It is best to keep the text concise. If a step is too complex, consider breaking it down into a nested activity diagram rather than making the rectangle huge.
3. Decision Nodes
Real-world processes are rarely linear. They involve choices. The diamond shape represents a decision node. An arrow enters the diamond, and multiple arrows exit it. Each exiting arrow must have a label describing the condition required to take that path, such as “Yes”, “No”, or “Valid”, “Invalid”. It is crucial to label every path leaving a decision node to prevent ambiguity.
4. Fork and Join Nodes
Complex systems often perform tasks simultaneously. A thick horizontal or vertical bar is used to represent a fork or a join. A Fork splits a single flow into multiple concurrent flows. This means the system can do multiple things at once. A Join merges these concurrent flows back into a single flow. You cannot merge flows arbitrarily; you must wait for all incoming branches to complete before proceeding.
Step-by-Step Guide to Drawing Your Diagram 📝
Now that you know the symbols, let us put them together. You do not need a specific software suite to begin. You can use a whiteboard, a piece of paper, or a digital canvas. The goal is to capture the logic accurately.
Step 1: Define the Scope and Trigger
Before drawing a single line, ask yourself what starts this process. Is it a user clicking a button? Is it a scheduled task? Write this down. This defines your Initial Node. For example, “User submits login form”.
Step 2: Identify the Main Actors
Who is involved in this process? Is it just the user? Is there a database? Is there a third-party service? Knowing the actors helps you decide if you need swimlanes later. For now, just keep a list of the entities involved.
Step 3: Map the Primary Flow
Draw the “Happy Path” first. This is the sequence of actions that occurs when everything goes perfectly. Start with the Initial Node. Draw a rectangle for the first action. Connect it to the next action with an arrow. Continue this until you reach a logical end point. Do not worry about errors yet.
Step 4: Add Decision Points
Review the Happy Path. Are there moments where the outcome changes based on input? Insert a diamond shape at these points. Label the outgoing arrows with the conditions. For instance, after “Check Password”, you have “Correct” and “Incorrect” paths.
Step 5: Handle Exceptions
What happens if something goes wrong? Does the user get redirected? Do they receive an error message? Add these branches to your diagram. Ensure every decision node has a clear exit path that leads eventually to a Final Node.
Step 6: Review and Refine
Look at your diagram. Does it loop back correctly? Are there dead ends? Can you trace the path from start to finish for every possible scenario? If a path leads to nowhere, connect it to a Final Node. If two paths cross confusingly, rearrange the layout.
Using Swimlanes for Clarity 🏊
When a process involves multiple actors or systems, a single list of activities can become messy. This is where Swimlanes come in. Swimlanes divide the diagram into horizontal or vertical sections, each assigned to a specific actor, system, or department. This visual separation makes it easy to see who is responsible for which action.
For example, in an e-commerce order process, you might have swimlanes for “Customer”, “Web Server”, and “Payment Gateway”. If the customer enters data, that action sits in the Customer lane. If the server validates it, it moves to the Web Server lane. This clarifies the handoffs between different parts of the system.
- Horizontal Swimlanes: Best for processes that flow from top to bottom.
- Vertical Swimlanes: Best for processes that flow from left to right.
- Consistency: Keep the lanes consistent throughout the diagram to avoid confusion.
When drawing, ensure that arrows crossing between lanes represent a handoff or communication. This is critical for understanding system boundaries.
Real-World Scenarios 🌍
Let us look at two common scenarios to illustrate how these concepts apply in practice.
Scenario 1: User Authentication Flow 🔐
This is a classic example of decision nodes and flow control.
- Start: User enters credentials.
- Action: System validates credentials against the database.
- Decision: Are credentials valid?
- Path A (Yes): Create session token → Redirect to Dashboard → End.
- Path B (No): Display error message → Allow retry → Loop back to start OR End after max attempts.
Scenario 2: E-Commerce Order Processing 🛒
This scenario involves swimlanes and parallel processing.
- Customer Lane: Selects items → Clicks Checkout.
- System Lane: Validates inventory → Calculates total.
- Payment Lane: Processes payment.
- Fork: While payment processes, System sends confirmation email.
- Join: Wait for payment success AND email sent.
- Action: Update order status to “Paid”.
- End: Order complete.
Common Mistakes to Avoid ❌
Even experienced modelers make mistakes. Being aware of common pitfalls will save you time during revisions.
- Too Many Crossings: If arrows cross each other excessively, the diagram becomes unreadable. Rearrange the layout to minimize intersections.
- Missing Labels: Never leave a decision node without labels on the outgoing paths. “Yes/No” is better than no label, but “Valid/Invalid” is best.
- Dead Ends: Every path must eventually lead to a Final Node. If a path stops, the user or system is stuck.
- Complex Logic in One Box: If an action box is too long, it means the action is actually multiple steps. Break it down.
- Ignoring Parallelism: If two things happen at once, use Fork/Join nodes. Do not draw them sequentially unless they must wait for each other.
Best Practices for Readability ✨
A diagram is a communication tool. If the reader struggles to understand it, the diagram has failed. Follow these guidelines to ensure your work is professional and clear.
- Consistent Direction: Flow generally should go from top to bottom or left to right. Avoid arrows pointing upward unless necessary for a loop.
- Uniform Symbols: Keep the size of the rectangles and circles consistent. A huge action box next to a tiny one looks unprofessional and suggests hierarchy where none exists.
- Descriptive Labels: Use action verbs. “Process” is vague. “Process Payment” is clear. “Validate Input” is better than “Check”.
- White Space: Do not cram elements together. Use space to group related logic. A crowded diagram is hard to read.
- Version Control: Since diagrams evolve, keep track of changes. Update the legend or notes if the meaning of a symbol changes over time.
Integrating with Other Models 🧩
Activity diagrams rarely stand alone. They are part of a larger modeling ecosystem. Understanding how they fit with other UML diagrams adds depth to your analysis.
- Class Diagrams: Your activity diagram actions often map to methods in the class diagram. If you see “Calculate Tax”, look for a method in your classes that handles this logic.
- Sequence Diagrams: Sequence diagrams show interaction between objects over time. Activity diagrams show the logic flow. You can use the activity diagram to define the steps, and the sequence diagram to define how the objects talk during those steps.
- State Machine Diagrams: If the focus is on the state of a single object rather than the workflow of the system, use a state machine. Use activity diagrams for the process flow.
Refining Your Process 🛠️
Creating the first draft is only half the battle. The refinement process is where the true value lies. Review your diagram with a critical eye. Ask the following questions:
- Is the logic sound? Does every input lead to a valid output?
- Is it efficient? Are there redundant steps that can be removed?
- Is it scalable? If the system grows, will this diagram still hold up?
- Is it understandable? Show it to a colleague who does not know the project. If they understand it, it is good.
Remember that a diagram is a living document. As requirements change, the diagram must change. Do not be afraid to redraw sections or entirely rewrite the flow when the business logic shifts.
Final Thoughts on Process Modeling 🧭
Building a UML activity diagram is an exercise in logical thinking. It forces you to slow down and consider every branch of a decision. It reveals hidden complexities in a system that might otherwise remain buried in code. By mastering the symbols, understanding the flow, and adhering to best practices, you create a blueprint that guides development and ensures alignment among all stakeholders.
Start simple. Draw the happy path. Then layer in the exceptions. Use swimlanes to clarify responsibility. Keep your labels clear and your layout clean. With practice, drawing these diagrams will become second nature, providing you with a powerful tool for system design and analysis.
Whether you are working on a small script or a large enterprise system, the clarity provided by a well-drawn activity diagram is invaluable. It turns abstract logic into a tangible visual map, making the complex simple and the invisible visible.