


In the landscape of system design and software engineering, few artifacts are as ubiquitous as the Unified Modeling Language (UML) activity diagram. These flowcharts provide a visual representation of the flow of control from one activity to another. They are taught in universities, mandated by corporate standards, and often expected in project documentation. However, a critical question remains unasked in many development cycles: when is the effort required to create an activity diagram actually detrimental to the project? ⏳
Modeling is a tool for communication and clarity, not an end in itself. When applied without discretion, it becomes a burden. This guide explores the specific contexts where skipping UML activity diagrams is the superior engineering decision. We will analyze the trade-offs, identify scenarios where alternative documentation suffices, and establish a framework for pragmatic design communication. 🧠
Understanding the Activity Diagram Artifact 📊
An activity diagram is primarily used to model the dynamic aspects of a system. It describes the flow of activities, including decision points, parallel processes, and object flows. While useful for visualizing complex business logic or concurrency, it is often confused with a sequence diagram or a simple flowchart. The distinction matters because the overhead of maintaining a rigorous UML artifact is significantly higher than that of a rough sketch.
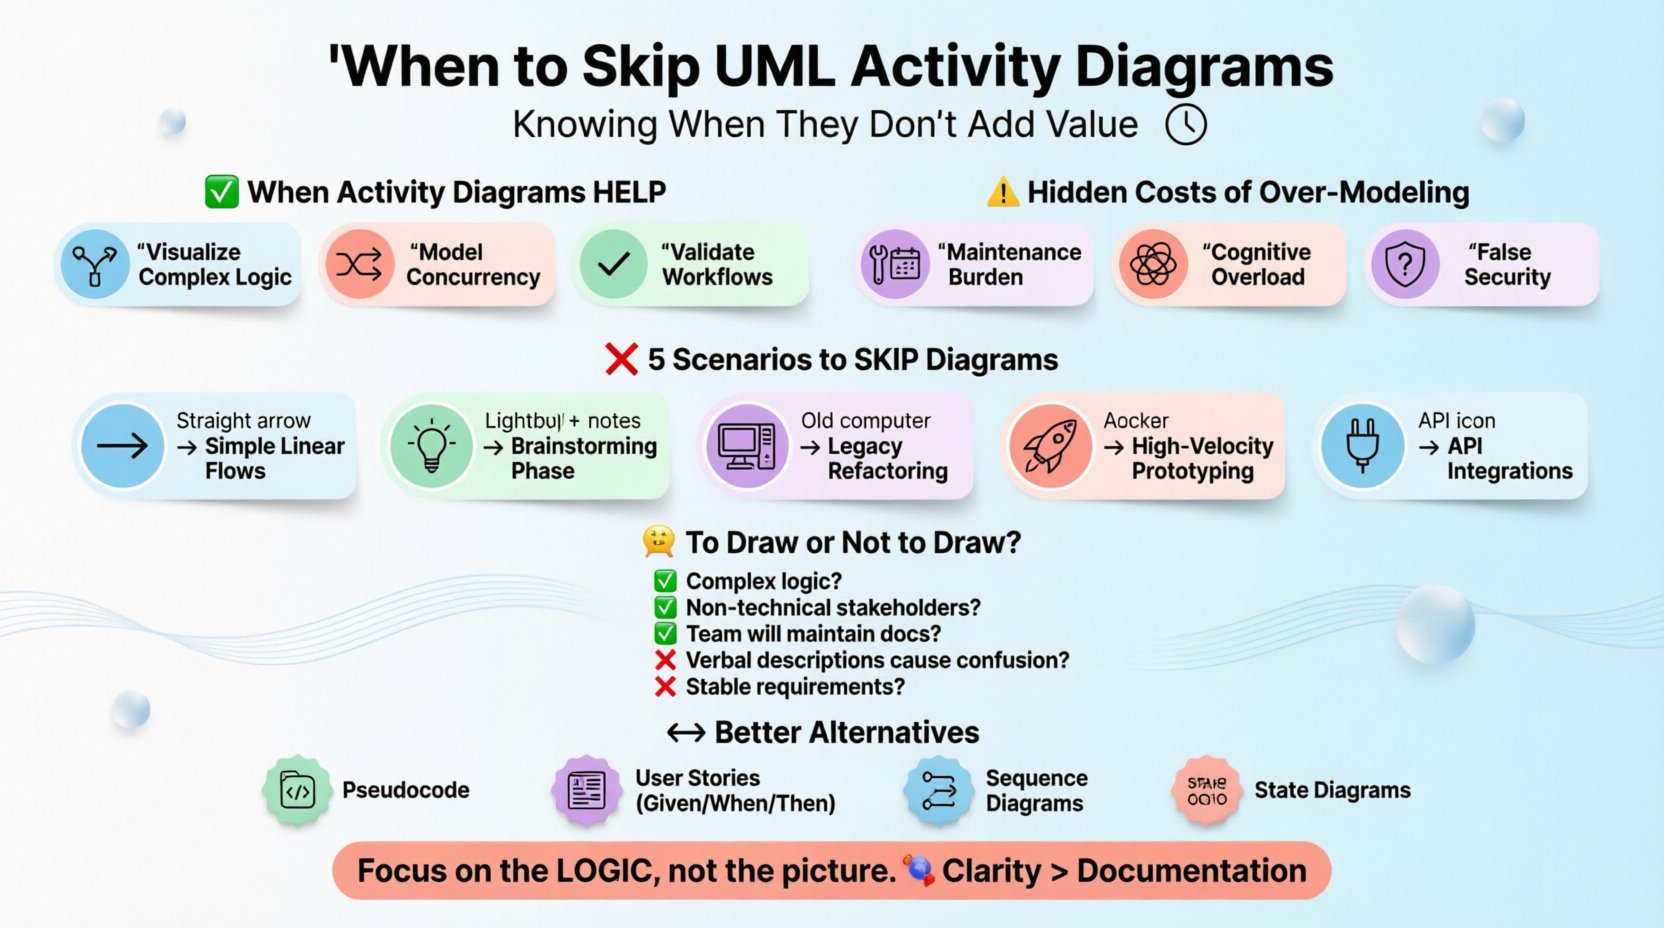
When used correctly, these diagrams serve three main purposes:
- Visualizing Complex Logic: They clarify branching paths that are difficult to describe in text alone.
- Concurrency Modeling: They show how multiple threads or processes interact simultaneously.
- Workflow Validation: They help stakeholders verify that a business process aligns with system capabilities.
However, these benefits only materialize if the diagram is accurate and maintained. If the diagram diverges from the code, it becomes technical debt in graphical form. 📉
The Hidden Costs of Over-Modeling 💸
Before deciding to skip a diagram, one must understand what is being sacrificed. The cost is not just time; it is opportunity cost. Every hour spent drawing nodes and connectors is an hour not spent coding, testing, or collaborating with users.
1. The Maintenance Burden
Software is mutable. Requirements change. Features are added. If an activity diagram is created at the beginning of a sprint, it may be obsolete by the next review. Keeping diagrams in sync with code requires discipline that many teams lack. When the diagram no longer matches the implementation, it creates confusion rather than clarity. Teams often stop trusting the documentation entirely.
2. Cognitive Overload
Complex activity diagrams can become spaghetti charts. They contain too many swimlanes, guard conditions, and object flows. Instead of simplifying the system, they can obscure the core logic. A developer staring at a dense diagram may spend more time decoding the notation than understanding the business requirement.
3. False Sense of Security
There is a psychological trap where stakeholders believe that because a diagram exists, the problem is solved. They may sign off on a design based on the visual flow, overlooking edge cases that the diagram did not explicitly address. The diagram becomes a placeholder for deep thinking rather than a tool to aid it.
Scenarios Where Skipping is the Right Move 🚫
Not every process needs a formal diagram. Determining when to skip requires a clear understanding of the project context. Below are specific scenarios where the value proposition of an activity diagram drops below zero.
1. Simple Linear Flows
If a feature involves a single path from start to finish with no branching or parallelism, a diagram is redundant. A user story or a simple text description is faster to read and easier to update. Drawing a box for “Start” and a box for “End” connected by an arrow adds no value.
2. Brainstorming and Early Exploration
During the initial discovery phase, ideas are fluid and rapidly evolving. Creating formal UML at this stage locks the team into a specific structure before the problem is fully understood. Sketches on a whiteboard or sticky notes are sufficient. The goal is exploration, not documentation.
3. Legacy System Refactoring
When working with legacy code, the original design documentation is often missing or inaccurate. Reversing engineering an activity diagram from existing code is time-consuming and prone to error. It is often better to document the logic inline within the code or through comments during the refactoring process.
4. High-Velocity Prototyping
In environments where speed is the primary metric, such as hackathons or MVP development, documentation overhead slows delivery. The focus should be on building functional software. Diagrams can be created later if the logic is found to be complex enough to warrant it.
5. API Integration Points
For simple API integrations, the contract is defined by the interface definition (like OpenAPI or WSDL). An activity diagram adds little value here because the request-response cycle is standard. A sequence diagram is more appropriate for showing the interaction between systems, while the activity diagram is overkill for a simple call.
The Decision Matrix: To Draw or Not to Draw? 🤔
To make a consistent decision, teams can use a weighted checklist. If the answer to the majority of these questions is “No,” skip the diagram.
| Criteria | Draw Diagram | Skip Diagram |
|---|---|---|
| Complexity of Logic | Multiple branches, loops, or concurrency | Linear or single-condition flow |
| Stakeholder Needs | Non-technical users need visual validation | Technical team only; text suffices |
| Maintenance Willingness | Team commits to updating docs with code | High churn rate; docs will rot |
| Communication Gap | Verbal descriptions cause frequent misunderstandings | Team aligns well on text descriptions |
| Project Phase | Stable requirements; ready for implementation | Exploratory; requirements changing daily |
Effective Alternatives to Activity Diagrams 🔄
If you decide to skip the activity diagram, you still need to communicate the logic. Several alternative methods are often more efficient and maintainable.
1. Pseudocode and Structured Text
Writing out the logic in pseudocode is closer to the implementation than a diagram. It captures the decision trees without the overhead of graphical tools. It can be placed directly in the code comments or in a technical specification document.
- Pros: Precise, easy to update, executable as a mental check.
- Cons: Not visual; requires reading comprehension.
2. User Stories with Acceptance Criteria
In agile environments, user stories define the “what” and acceptance criteria define the “how.” Gherkin syntax (Given/When/Then) is excellent for defining the flow of behavior without drawing boxes. It forces the team to think about edge cases explicitly.
- Example: “Given a user is logged out, When they submit a form, Then they are redirected to the login screen.”
3. Sequence Diagrams
For systems where the interaction between components is more critical than the internal logic flow, a sequence diagram is superior. It shows the timing and order of messages between objects. This is often what is actually needed for integration testing.
4. State Transition Diagrams
If the complexity lies in the states of an object rather than the flow of actions, a state diagram is the correct tool. Activity diagrams can become messy when trying to represent state changes. A state diagram isolates the state logic clearly.
Signs of Modeling Fatigue 🏳️
Teams often fall into the trap of modeling just because it is expected. Watch for these signs that your documentation process is causing more harm than good:
- Delays in Development: Developers are waiting for diagrams to be approved before writing code.
- Disconnection from Code: The code implements a different logic than what is drawn.
- Review Bottlenecks: Diagram reviews take longer than code reviews.
- Tool Dependency: The team spends more time configuring the drawing software than thinking about the system.
- Stakeholder Apathy: Stakeholders say they don’t understand the diagrams or stop reading them.
When these symptoms appear, it is time to pause and reassess the documentation strategy. Often, a reduction in documentation artifacts leads to an increase in velocity and quality.
Strategic Integration of Diagrams 🧩
Skip does not mean never. It means selective. The goal is to use diagrams where they provide the highest return on investment. Consider this approach:
- Identify the Critical Path: Where is the highest risk of misunderstanding? Is it the authentication flow? The payment processing?
- Draw Only for Risk: Create diagrams only for the areas identified in step one.
- Keep it Rough: Use tools that allow rapid iteration. Do not spend hours perfecting alignment or colors.
- Link to Code: If a diagram exists, link it to the relevant code module. If the code changes, update the link or the diagram.
- Retire Old Diagrams: Archive or delete diagrams that are no longer relevant to the current version of the system.
Impact on Team Dynamics and Culture 🤝
Documentation standards affect team culture. A mandate to draw diagrams for every feature can signal a lack of trust in the developers’ ability to communicate via text. It can also create a hierarchy where the person who draws the best diagrams is valued over the person who writes the cleanest code.
By empowering teams to skip diagrams when unnecessary, you signal that clarity of thought is more important than the medium of presentation. This fosters a culture of pragmatism. Teams become more focused on solving the problem rather than producing artifacts.
Trust and Autonomy
When developers are trusted to document their logic in text or code comments, they take ownership of the design. They are not just implementing a drawing; they are defining the logic. This autonomy improves morale and code quality.
Collaboration Efficiency
Text-based communication allows for easier version control. You can diff a text file to see what changed in the logic. Diffing a binary image or a proprietary drawing file is often impossible. Text-based logic integrates seamlessly into the code repository.
Long-Term Maintenance and Knowledge Transfer 📚
One of the strongest arguments for skipping activity diagrams is the long-term maintenance of the knowledge base. New hires need to understand the system. If the system relies on a set of diagrams that are outdated, the new hire will be confused. If the system relies on code and inline documentation, the new hire can learn by reading the implementation.
Furthermore, diagrams are static. The system is dynamic. A diagram captures a moment in time. Code captures the current reality. Relying on diagrams for knowledge transfer is a gamble against time.
Final Thoughts on Pragmatic Design 🎯
The decision to create a UML activity diagram is a resource allocation problem. It requires time, tools, and attention. In many contexts, that investment yields little return. By recognizing when a diagram adds value and when it acts as a barrier, teams can maintain higher quality standards without the overhead of unnecessary documentation.
Focus on the logic, not the picture. If the logic is complex, a diagram might help. If the logic is simple, let the code speak. The most effective systems are often those where the documentation is lean, the code is clear, and the team is aligned on the problem, not the drawing. 🚀
Remember, the goal of software engineering is to build working systems, not to produce perfect diagrams. Prioritize value, minimize waste, and keep the flow moving forward.