


Understanding complex processes is a foundational skill in systems design. When stakeholders, developers, and business analysts converge, a shared visual language prevents misinterpretation. The Unified Modeling Language (UML) Activity Diagram serves this purpose effectively. It visualizes the flow of control and data from start to finish. Many teams struggle with these diagrams, resulting in ambiguous maps that lead to implementation errors. This guide provides a structured approach to constructing accurate diagrams without relying on trial and error.
Why Precision Matters in Workflow Modeling 🎯
Guessing the sequence of operations creates technical debt before code is even written. Ambiguity in a diagram often translates to ambiguity in the software logic. When a process involves multiple actors or conditional branches, a clear representation becomes non-negotiable. An accurate diagram acts as a contract between the design phase and the development phase. It ensures everyone agrees on the path the system takes when a specific input occurs.
Accuracy brings several tangible benefits:
- Reduced Rework: Catching logic errors early prevents expensive code changes later.
- Clearer Communication: Non-technical stakeholders can verify workflows visually.
- Testability: Test cases map directly to the paths shown in the diagram.
- Documentation: Future maintainers understand the original intent of the system.
Core Components of an Activity Diagram 🧩
Before drawing lines, you must understand the building blocks. Every activity diagram consists of specific nodes and edges. These elements define where the flow starts, stops, branches, or joins. Using standard notation ensures that anyone reading the diagram interprets it correctly.
1. Initial and Final Nodes
The process begins at a solid black circle, known as the Initial Node. This represents the trigger or entry point. Conversely, the process ends at a solid black circle surrounded by a ring, called the Final Node. This indicates the successful completion of the activity. In some cases, multiple final nodes exist to represent different termination states (e.g., success vs. cancellation).
2. Activity States
These are the rounded rectangles that represent a specific action or operation. An activity state has a name inside the box. It implies a duration of time or a computational step. If the action takes significant time, a note can be attached to indicate asynchronous behavior.
3. Decision and Merge Nodes
Decision nodes look like diamonds. They control the branching of the flow based on a condition. Only one outgoing edge is active at a time. Merge nodes combine multiple incoming flows back into a single path. They do not contain logic; they simply reunite branches that diverged earlier.
4. Control Flow vs. Object Flow
It is critical to distinguish between control and data. A control flow arrow (open arrowhead) shows the sequence of actions. An object flow arrow (filled arrowhead) shows the movement of data or objects between activities. Confusing these two leads to logic errors regarding what triggers the next step.
Symbol Reference Guide 📋
Using the correct symbol is the first step toward accuracy. Below is a reference table for the most common elements you will encounter during modeling.
| Symbol Name | Visual Representation | Purpose |
|---|---|---|
| Initial Node | ● (Solid Black Circle) | Start of the workflow |
| Final Node | ⦿ (Black Circle with Ring) | End of the workflow |
| Activity State | ⬜ (Rounded Rectangle) | An action or operation |
| Decision Node | ◆ (Diamond) | Branching based on conditions |
| Fork Node | ⏸ (Thick Horizontal Bar) | Starts concurrent threads |
| Join Node | ⏹ (Thick Horizontal Bar) | Ends concurrent threads |
| Swimlane Boundary | Vertical Line | Categorizes activities by role |
| Control Flow | → (Open Arrow) | Sequence of control |
| Object Flow | ➔ (Filled Arrow) | Movement of data |
Step-by-Step Construction Process 🛠️
Building a diagram is not about drawing lines immediately. It requires preparation, structuring, and validation. Follow this logical sequence to ensure the final output is robust.
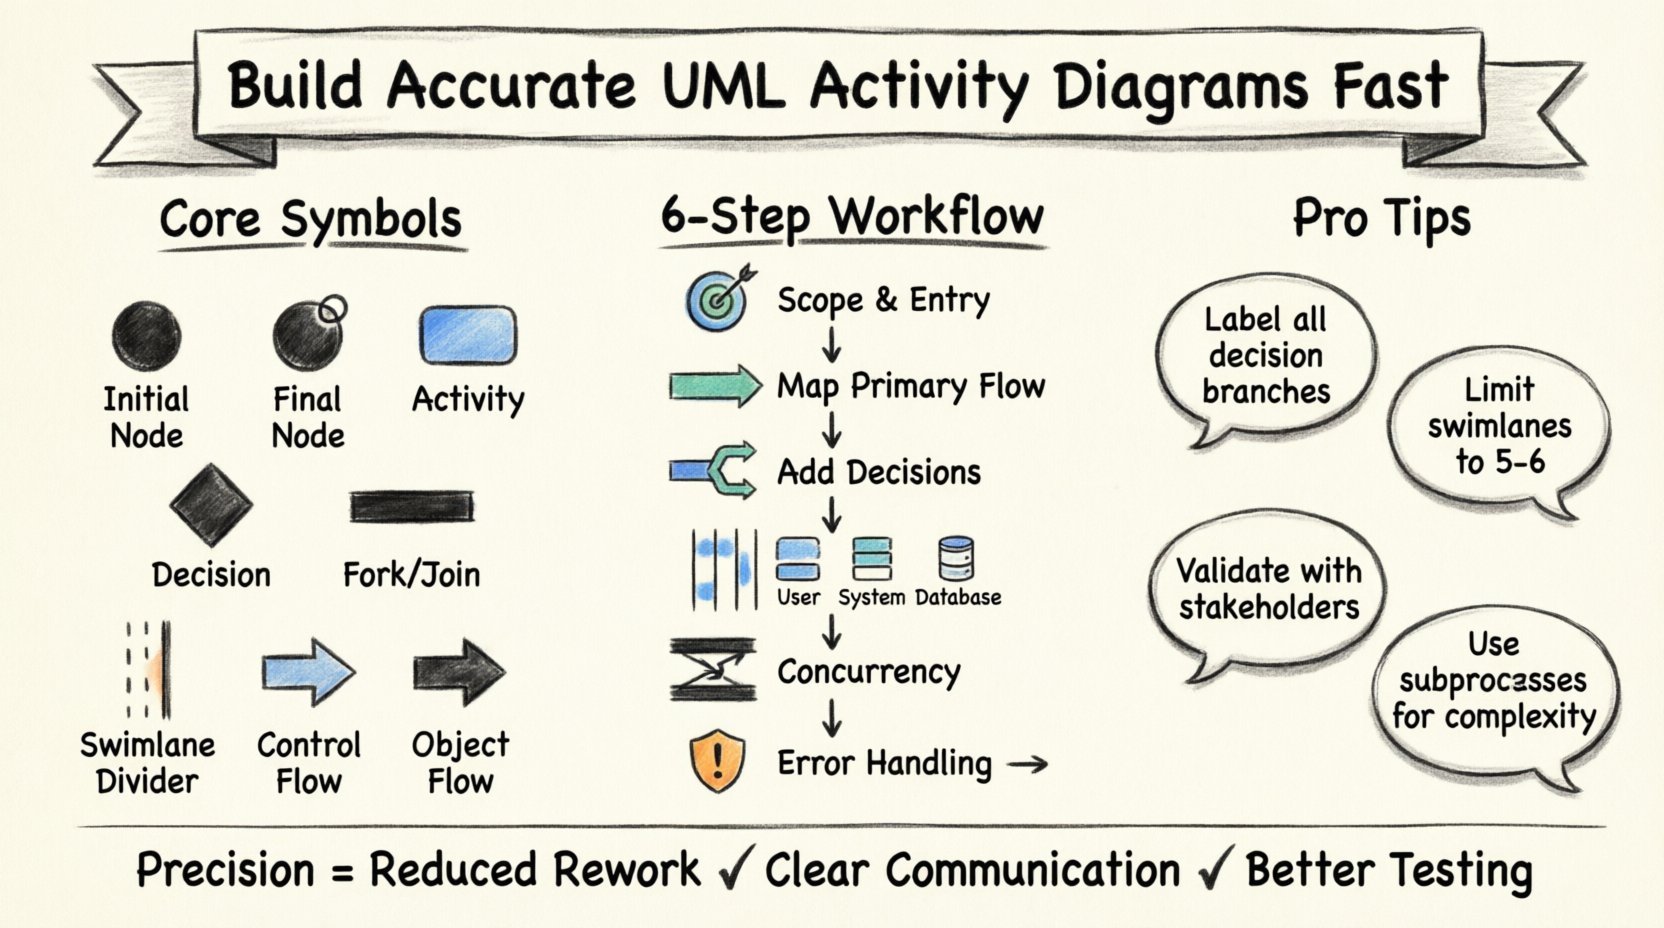
Step 1: Define the Scope and Entry Point
Identify the specific use case you are modeling. Is this a user login? A payment processing flow? A data backup routine? Start by placing the Initial Node. Label the trigger that activates the diagram. This prevents the model from becoming too broad and losing focus.
Step 2: Map the Primary Flow
Draw the happy path first. This is the sequence of activities that occurs when everything goes as planned. Connect the Initial Node to the first activity, then proceed through the main steps until you reach the Final Node. Do not worry about exceptions yet. Establish the baseline logic.
Step 3: Identify Decision Points
Review the primary flow for conditions. Where does the system need to make a choice? Insert a Decision Node. Create outgoing edges for each possible outcome (e.g., Yes/No, Valid/Invalid). Label these edges clearly. This is where most errors occur, so verify that every condition is covered.
Step 4: Introduce Swimlanes for Roles
Once the logic is clear, organize activities by responsibility. Draw vertical lines to create swimlanes. Assign each lane to a specific actor (e.g., User, System, Database). Move the activity states into the appropriate lanes. This clarifies who is responsible for each action and highlights handoff points between actors.
Step 5: Handle Concurrency
If multiple actions happen simultaneously, use Fork and Join nodes. A Fork splits the control flow into parallel threads. A Join waits for all parallel threads to complete before continuing. Use thick bars for these nodes. Ensure you do not create deadlocks by joining flows that never finish.
Step 6: Add Error Handling
Return to the decision points and map the exception paths. What happens if a user enters incorrect data? What if a server connection fails? Create separate branches for these scenarios. Ensure they eventually lead to a Final Node, either for recovery or graceful termination.
Swimlanes and Responsibility Mapping 🏊
Swimlanes are essential for complex systems involving multiple agents. Without them, a diagram becomes a tangled web of logic. Swimlanes provide a visual hierarchy that separates concerns.
Best Practices for Swimlanes
- Limit the Number: Avoid having more than five or six lanes. If you have more, group roles into categories.
- Consistent Ordering: Keep the order of lanes consistent throughout the diagram (e.g., always place User at the top).
- Minimize Crossing: Try to arrange activities so that control flow arrows do not cross swimlane boundaries excessively.
- Clear Labels: Label each lane clearly at the top or bottom.
When to Use Object Flow in Swimlanes
When an activity in one lane produces data consumed by an activity in another lane, use an Object Flow. Draw a dashed line or a specific object symbol to represent the artifact passing between the lanes. This visualizes the data dependency explicitly.
Common Pitfalls and How to Avoid Them ⚠️
Even experienced modelers make mistakes. Being aware of common traps helps you maintain accuracy. Review the checklist below before finalizing your work.
- Disconnected Paths: Ensure every node is reachable from the Initial Node. Dead ends indicate a logic gap.
- Missing Conditions: Decision nodes must have labels on all outgoing edges. If a path has no label, the condition is undefined.
- Looping Errors: Be careful with loops. Ensure there is a condition that eventually allows the loop to exit. Infinite loops are logical errors.
- Overlapping Lanes: Activities should strictly belong to one lane. If an action belongs to multiple actors, split it or clarify the handoff.
- Ignoring Asynchrony: If an activity takes a long time, do not block the flow. Use notes to indicate that the process continues in the background.
Validation and Review Strategies 🧐
A diagram is not complete until it is reviewed. Validation ensures the model matches the requirements. Use the following methods to verify your work.
Walkthrough with Stakeholders
Conduct a walkthrough session with the people who own the business process. Walk through the diagram step-by-step. Ask them to confirm if the sequence matches their real-world experience. This is the most effective way to catch semantic errors.
Traceability Check
Map each activity in the diagram back to a requirement. If an activity exists without a requirement, it might be unnecessary. If a requirement has no corresponding activity, it is missing. This ensures the diagram is complete.
Consistency with Other Diagrams
An activity diagram should align with Use Case Diagrams and Sequence Diagrams. The actions in the activity diagram should correspond to the interactions shown in sequence diagrams. Inconsistencies here suggest a misunderstanding of the system boundaries.
Advanced Techniques for Complex Flows 🔗
As systems grow, simple flows become insufficient. Advanced techniques help manage complexity without sacrificing clarity.
Subprocesses and Inlines
When a specific section of the diagram is too detailed, encapsulate it. Use a subprocess notation (a rectangle with a folded corner) to represent a nested activity. You can define the details of this subprocess in a separate diagram. This keeps the main view clean.
Interrupts and Exception Handlers
Sometimes an external event interrupts the flow. Use an Interruptible Region (a dashed box) to group activities that can be preempted. If an exception occurs, the flow exits the region immediately. This is crucial for modeling system interrupts or timeouts.
Data Store Symbols
When the diagram involves reading from or writing to a database, use a data store symbol. This distinguishes between a logical calculation and a physical data operation. It helps developers identify where persistence is required.
Integrating with the Design Ecosystem 🌐
Activity diagrams do not exist in isolation. They are part of a broader modeling ecosystem. Connecting them to other artifacts strengthens the overall design.
- Use Case Diagrams: The activity diagram implements the logic behind a specific use case.
- State Machine Diagrams: Use activity diagrams for the internal behavior of a state, or use state machines when the system has distinct states.
- Class Diagrams: Ensure the objects used in the activity diagram match the classes defined in the class diagram.
Final Implementation Notes 💡
Building accurate UML Activity Diagrams is a disciplined process. It requires attention to detail, adherence to standards, and a willingness to iterate. By following the steps outlined here, you eliminate guesswork from your workflow design.
Remember that the goal is clarity. If a diagram is too complex to understand, simplify it. Break it down. Use swimlanes to separate concerns. Use subprocesses to hide detail until it is needed. Consistency in notation is more important than artistic flair.
Start with the initial node. Map the primary path. Add the decisions. Assign the roles. Validate the logic. With practice, creating these diagrams will become a natural part of your design workflow. This foundation supports better software, fewer defects, and clearer communication across the team.