
Mastering Mermaid Diagramming with VPasCode: A Developer’s Guide to Diagram-as-Code
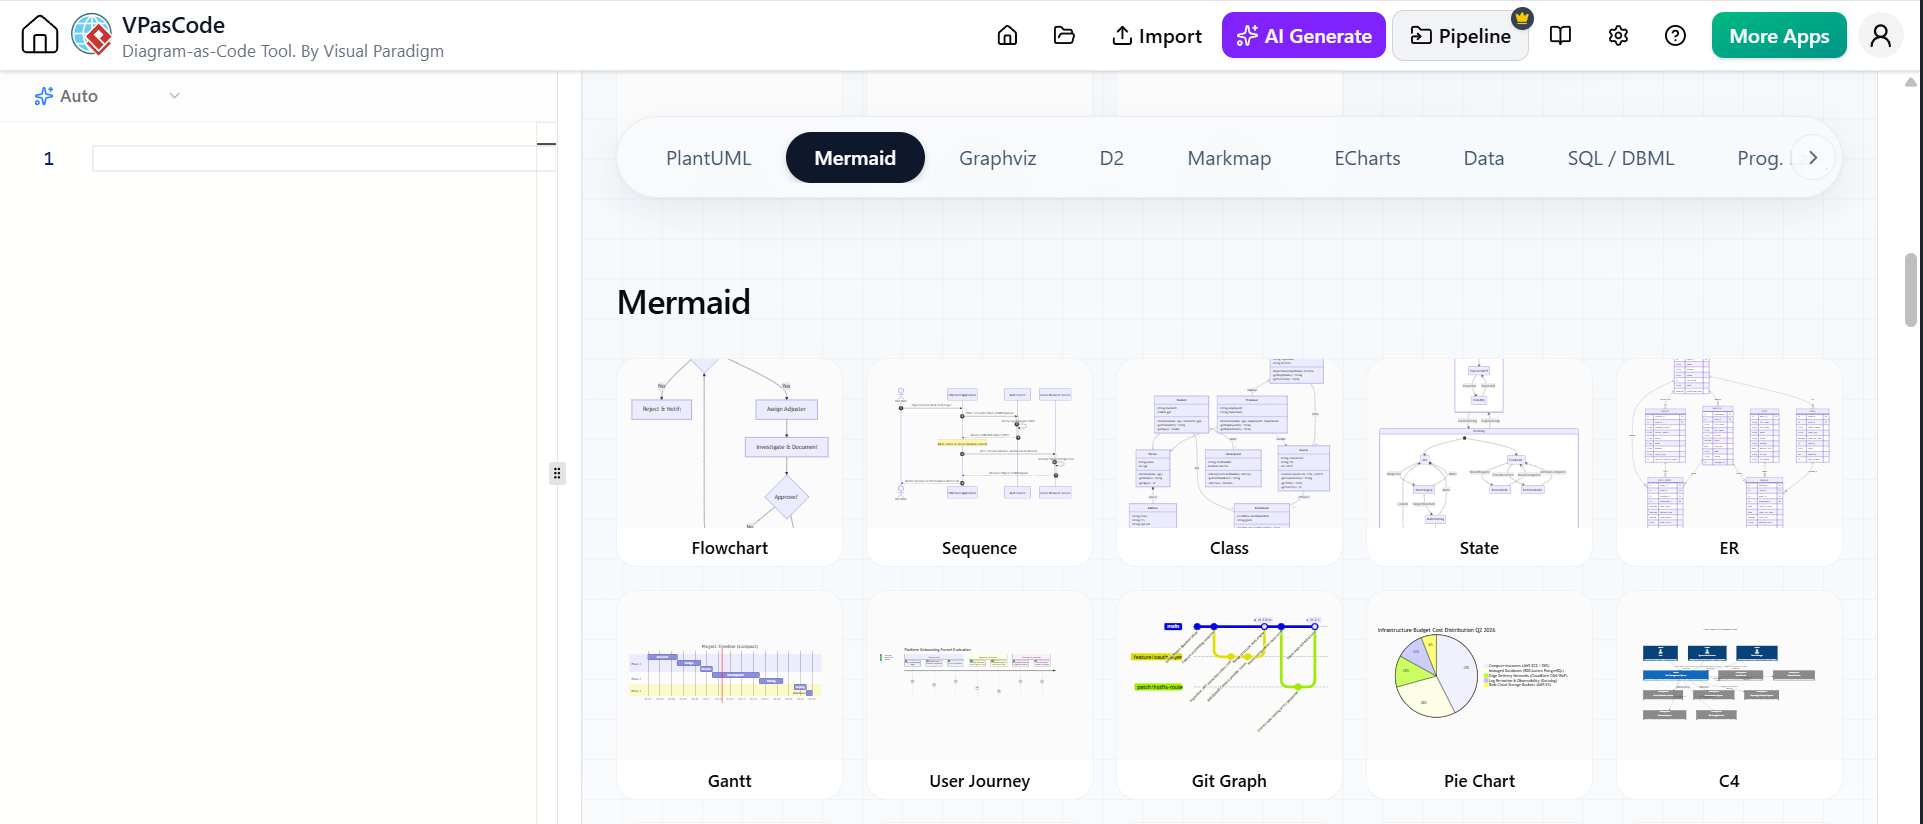
In the modern software development lifecycle, documentation is often an afterthought. However, the ability to visualize complex systems, processes, and data flows is crucial for team alignment. The image provided showcases the interface of VPasCode by Visual Paradigm, specifically highlighting its integration with Mermaid. This tutorial will guide you through the system architecture of diagramming as code, the versatility of Mermaid, and how to leverage these tools to create professional technical documentation.
Introduction: The Shift to Diagram-as-Code
Traditionally, creating diagrams required dragging and dropping shapes in a GUI (Graphical User Interface). While intuitive, these tools often lead to “diagram spaghetti”—messy layouts that are difficult to version control and hard to update. The paradigm shift towards Diagram-as-Code allows developers to define diagrams using simple text syntax.
VPasCode facilitates this workflow, offering a seamless environment where you can write code in a text editor (visible on the left side of the UI) and see the rendered result instantly. The interface in the screenshot demonstrates this capability by rendering a diverse array of diagram types, all driven by code.
Understanding Mermaid: The Swiss Army Knife of Documentation
Mermaid is a JavaScript-based diagramming and charting tool that renders Markdown-inspired text definitions to create and modify diagrams automatically. In the context of the VPasCode interface, Mermaid serves as the engine behind the “Mermaid” tab, allowing users to generate the following types of visualizations:
1. Process and Logic Visualization
One of the most common use cases shown in the screenshot is the Flowchart. This is essential for documenting business logic or algorithmic steps. Instead of manually drawing boxes, you define nodes and edges:
- Start/End Points: Defined using standard shapes.
- Logic Gates: Diamond shapes for decisions.
- Connectors: Arrows indicating the flow of control.
This is particularly useful for creating simple flowcharts that explain the “Why” and “How” of a system’s operation.
2. Interaction and Data Flow
For backend developers and system architects, understanding how components interact is vital. The screenshot displays a Sequence Diagram.
- Participants: Represented as vertical lines (lifelines).
- Messages: Horizontal arrows showing the exchange of data or API calls between objects.
This helps in visualizing the temporal order of interactions, making it easier to debug complex asynchronous processes.
3. Database and Structure Modeling
Data integrity is the backbone of any application. The interface highlights ER (Entity-Relationship) Diagrams and Class Diagrams.
- ER Diagrams: Define entities (tables), attributes (columns), and relationships (foreign keys), crucial for database schema design.
- Class Diagrams: Illustrate the static structure of a system, showing classes, attributes, operations, and relationships between objects.
4. Lifecycle and State Management
Systems often change states based on user input or events. The State Diagram shown in the screenshot is invaluable for modeling the lifecycle of an object (e.g., an Order moving from “Pending” to “Shipped” to “Delivered”). It helps developers ensure that state transitions are handled correctly in the code.
5. Project Management and Time
Software development is a time-bound activity. Mermaid within VPasCode supports Gantt Charts, which allow teams to visualize project schedules, dependencies, and milestones directly in their documentation files.
6. Version Control Visualization
For teams using Git, the Git Graph feature is a game-changer. It visualizes the branching and merging history, helping developers understand the lineage of the codebase and identify where conflicts might arise.
Technical Workflow: From Text to Visuals
Based on the interface shown, the workflow in VPasCode follows these steps:
- Input: The developer writes Mermaid syntax in the text editor pane (labeled “Auto” in the UI).
- Selection: The user selects the diagram type (e.g., Flowchart, Sequence) from the toolbar.
- Rendering: The VPasCode engine parses the code and renders the diagram in the preview pane.
- Export/Integration: The resulting diagram can be exported for use in Markdown documentation or GitHub READMEs.
Best Practices for Mermaid Documentation
- Keep it Simple: As noted in the context, Mermaid is best for “simple” diagrams. Avoid creating overly complex, nested diagrams that become unreadable.
- Version Control Friendly: Since the diagrams are text-based, they can be committed to Git alongside your source code. This ensures your documentation stays in sync with your codebase.
- Consistency: Use consistent naming conventions for nodes and classes to make the diagrams easier to maintain.
Conclusion
The screenshot of VPasCode illustrates the power of modern diagramming tools. By supporting Mermaid, it empowers developers to create high-quality documentation for flowcharts, sequence diagrams, state diagrams, and more, all within a unified environment.
However, while Mermaid is excellent for code-based visualization, sometimes a robust GUI is required for complex enterprise architecture. Therefore, for advanced modeling and comprehensive system architecture needs, it is recommended to utilize the Visual Paradigm VPasCode Tool or the full Visual Paradigm suite, which offers deep integration with UML standards and enterprise-grade modeling capabilities.