Imagine turning a complex topic like the solar energy process into a clear, engaging visual story in just a few minutes. That’s exactly what the AI Infographic Generator from Visual Paradigm makes possible. This powerful tool, powered by artificial intelligence, transforms your simple text ideas into professional, visually stunning infographics without requiring any design skills. It’s the fastest way to communicate complex information in a way that’s easy to understand and highly shareable. This guide will walk you through the entire process, step-by-step, using a real-world example to show you how it works.
Quick summary
- Start by choosing a professional template from a gallery of designs.
- Enter a clear text prompt describing your topic.
- Use the AI to generate structured data and content for your infographic.
- Let the tool automatically render the data into a beautiful visual layout.
- Make final adjustments to text and layout, then export as a high-quality SVG.
Getting Started: Choosing the Right Template
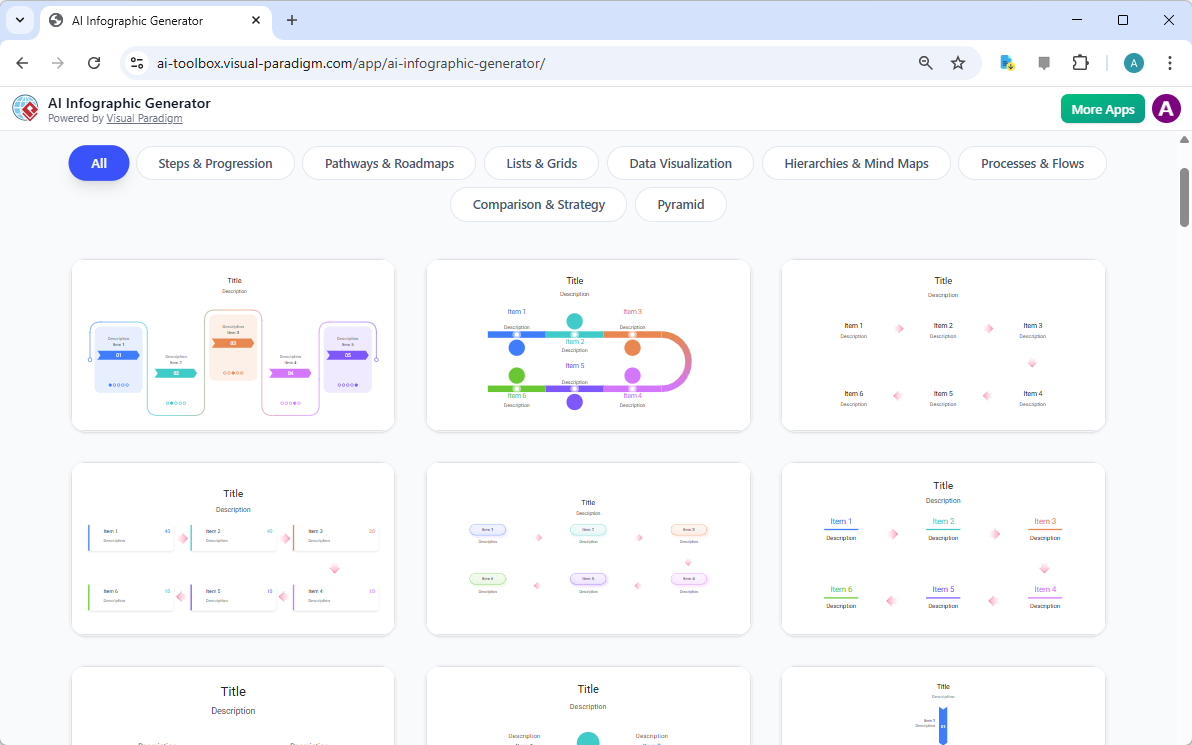
Before you can create your infographic, you need to pick a template. The first step is to browse the template gallery, which is designed to give you a professional foundation for your visual story. As you can see in Image 1, the AI Infographic Generator offers a wide variety of styles, from simple lists and grids to complex timelines and process flows. The key is to choose a template that matches the nature of your information. For a topic like “Steps in the Solar Energy Process,” a timeline or a progression-style layout is ideal because it naturally shows a sequence of events over time. This choice is crucial because it sets the entire visual structure for your infographic. The template provides the colors, fonts, and layout, ensuring your final product looks polished and professional from the very beginning.
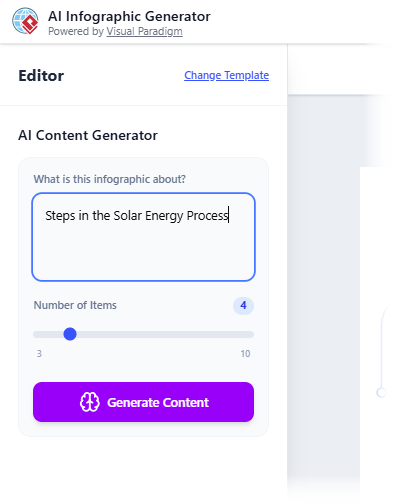
Entering Your Topic and Generating Content
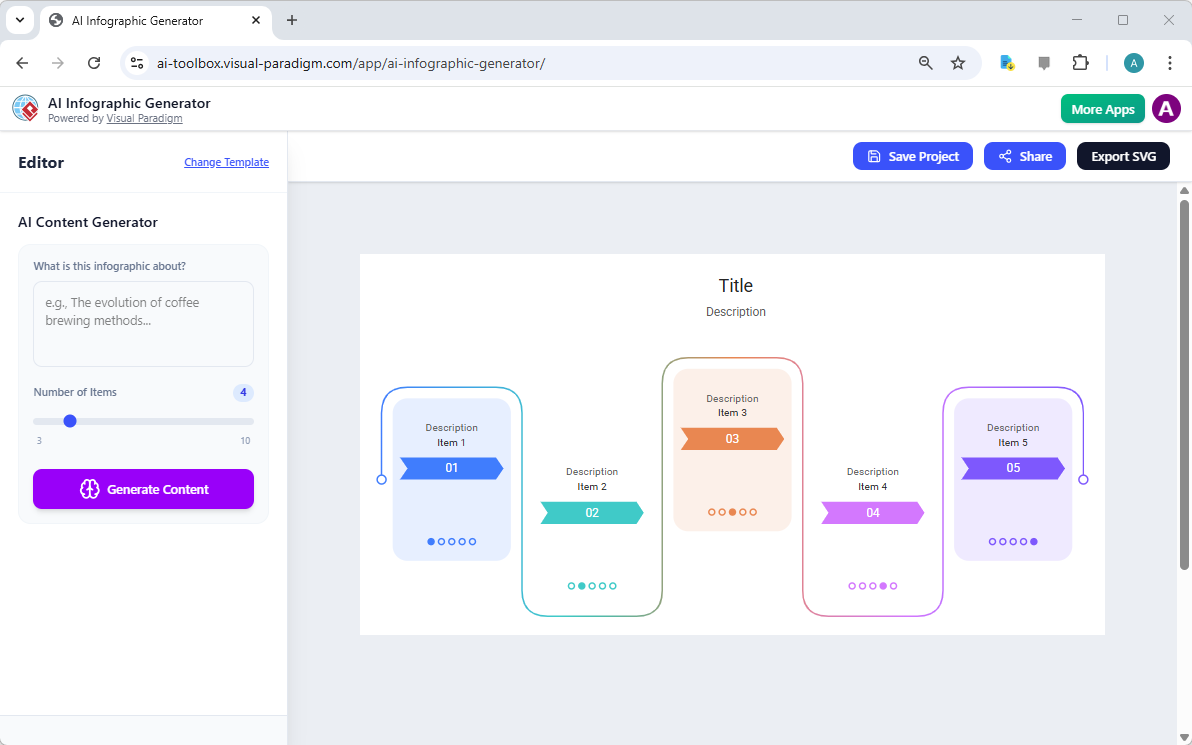
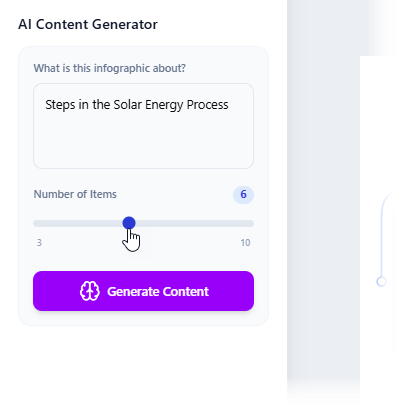
Once you’ve selected a template, you move to the editor, as shown in Image 2. The interface is clean and intuitive, with the input pane on the left and the infographic preview on the right. Your first task is to tell the AI what your infographic is about. In the “What is this infographic about?” field, you simply type a clear, descriptive prompt. For our example, we entered “Steps in the Solar Energy Process.” This is the core of the AI-powered creation process. The AI then uses your prompt to research and generate the actual content and data points for your infographic. To refine the output, you can also adjust the “Number of Items” slider, which determines how many distinct points or steps your infographic will contain. In Image 4, we’ve set the slider to 6, indicating we want six key stages in our solar energy timeline.
Letting the AI Do the Heavy Lifting
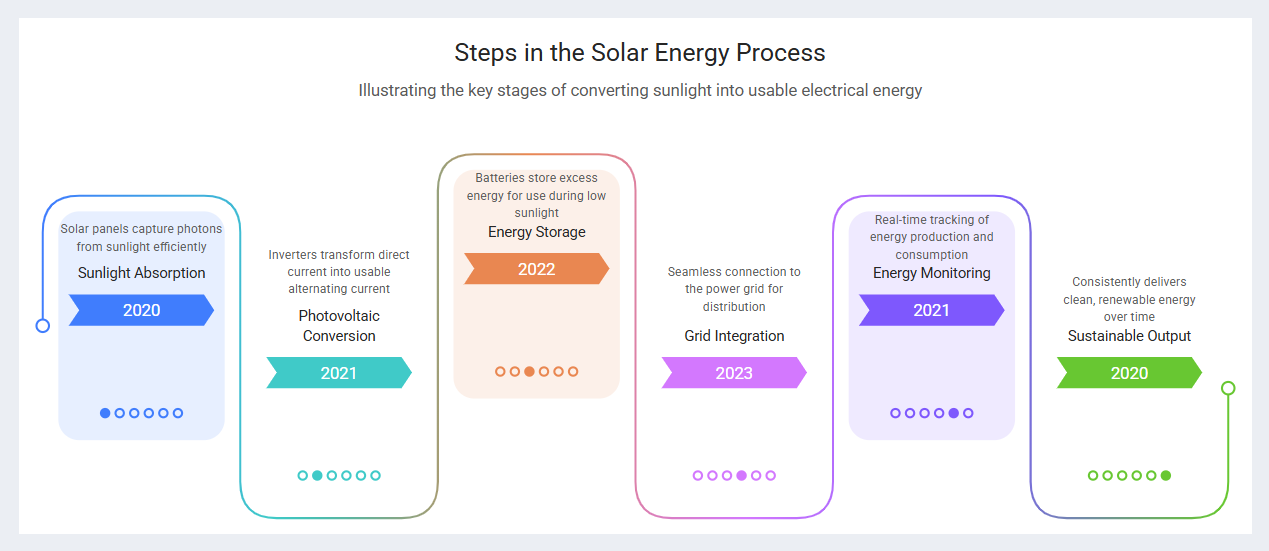
After you’ve entered your prompt and set the number of items, the magic happens when you click the “Generate Content” button. The AI analyzes your request, researches relevant information, and creates a structured set of data points. The result is an instant, fully-rendered infographic, as seen in Image 5. In this image, the AI has successfully generated a timeline with six stages, each with a title, description, and a year. The infographic is already visually appealing, with a clean layout and appropriate colors for each step. This is the core benefit of the tool: it eliminates the “blank page” problem and the tedious process of manually finding and organizing data. You get a complete, structured visual story in seconds, not hours.
Final Touches and Exporting
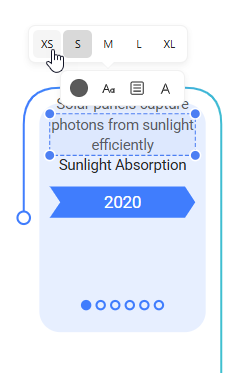
While the AI does a great job, the final step is to refine the visual details. The AI-generated infographic in Image 5 might have some minor issues, like text that’s too large or overlapping. This is where the editor’s fine-tuning tools come in. As shown in Image 6, you can easily resize text labels, edit the text, move elements, and change colors. This is a crucial step to ensure your infographic is perfectly readable and visually balanced. A key thing to note is that these manual changes are temporary; they won’t be saved to your project file. However, the changes you make will be preserved when you export the final image. This means you can make your final adjustments, then export the infographic as a high-quality, scalable SVG file, which is perfect for any use, from web publishing to high-resolution printing.
Finalize and Share Your Masterpiece
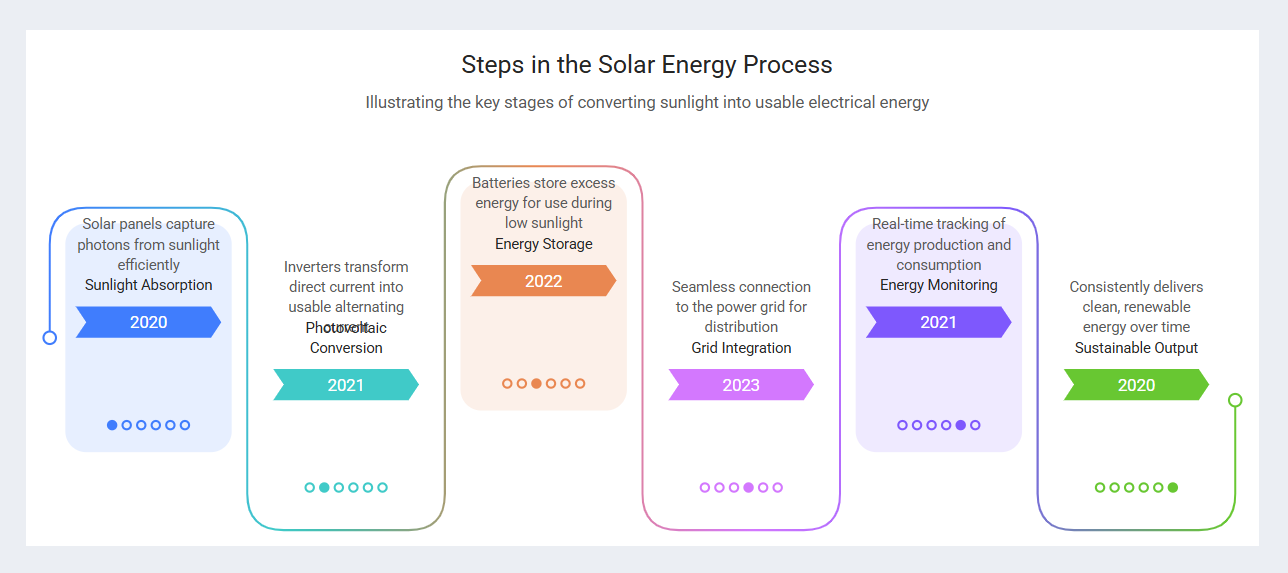
After making your final adjustments, you have a polished, professional infographic. The result, as seen in Image 7, is a clear, engaging visual that effectively communicates the complex process of solar energy conversion. The timeline is easy to follow, the text is perfectly sized, and the colors are distinct. You can now save your project to return to it later, or you can export it as an SVG file. You can also share it instantly with a single click, generating a unique, shareable link that anyone can view. This entire process, from a simple idea to a finished, professional infographic, is incredibly fast and easy, making the AI Infographic Generator a powerful tool for anyone who needs to communicate information visually.
Conclusion
The AI Infographic Generator from Visual Paradigm is a game-changer for creating professional visual content. It empowers users to transform any text-based idea into a compelling infographic in minutes, regardless of their design skills. By following a simple workflow—choose a template, enter a prompt, generate content, and make final adjustments—you can create high-impact visuals for presentations, marketing, education, and more. The tool’s AI does the hard work of research and data structuring, while its intuitive editor allows for quick, final refinements. This is the ultimate solution for anyone who wants to communicate complex information in a clear, engaging, and professional way.
Ready to create your own powerful visual story? Try the AI Infographic Generator now and see how easy it is to turn your ideas into stunning visuals.
Visual Reference: