
Mastering Visual Paradigm VPasCode: A Comprehensive Guide to Graphviz Modeling
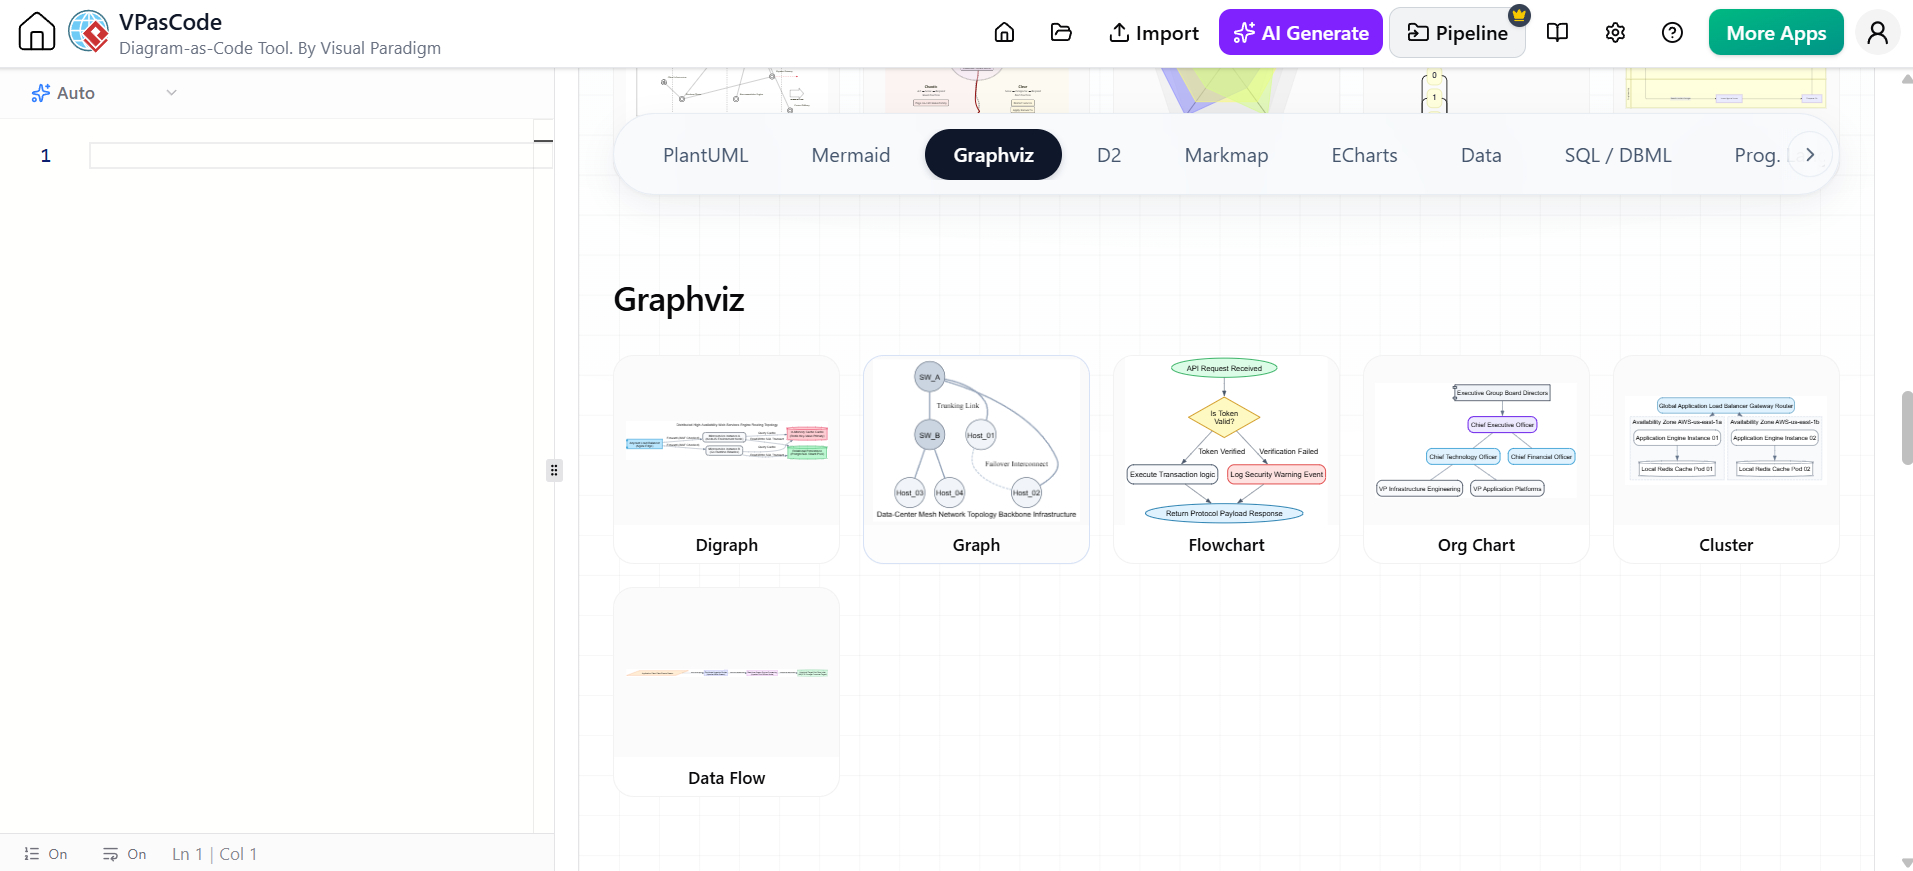
In the evolving landscape of software engineering and system architecture, the ability to translate abstract concepts into concrete visual representations is paramount. Visual Paradigm VPasCode stands at the forefront of this evolution, offering a powerful “Diagram-as-Code” approach. This tutorial explores the capabilities of the Graphviz engine within the VPasCode environment, providing a deep dive into how technical professionals can leverage this tool for network structures, dependency maps, and complex data flows.
What is Graphviz in the Context of VPasCode?
Graphviz (Graph Visualization Software) is a widely respected open-source tool for drawing diagrams defined by text descriptions. When integrated into VPasCode, it transforms the way developers and architects design systems. Instead of manually dragging and dropping shapes in a GUI, you write code to define the relationships and logic of your system.
This approach offers several distinct advantages:
- Version Control Friendly: Diagrams are plain text files, making them easy to track in Git or SVN.
- Consistency: Automated layout algorithms ensure that your diagrams look professional and organized, regardless of complexity.
- Scalability: Graphviz excels at handling massive networks that might otherwise clutter a standard drawing tool.
Core Applications of Graphviz Modeling
Based on the capabilities of the VPasCode tool, here are the primary scenarios where Graphviz shines:
1. Network Structures and Infrastructure Diagrams
For DevOps and System Architects, visualizing the topology of a network is critical. Graphviz can generate complex infrastructure diagrams that map out servers, load balancers, and database clusters. By defining nodes and edges, you can visualize the “backbone” of your IT environment instantly.
2. Dependency Maps
In large software projects, understanding which modules rely on others is vital for maintenance and refactoring. Graphviz creates clear dependency maps that highlight circular dependencies, isolated components, and critical paths within your codebase.
3. Data Flows
Data flow diagrams help engineers trace the journey of information from ingestion to output. Whether tracking user data in an application or logs in a monitoring system, the directed nature of Graphviz graphs makes it the perfect choice for illustrating flow logic.
The VPasCode Multi-Engine Philosophy
A unique strength of VPasCode is its multi-engine approach. Rather than forcing every user to adapt their thinking to a single syntax (like Mermaid or PlantUML), VPasCode allows users to select the most appropriate notation for the specific task at hand.
When working with Graphviz, you are utilizing a syntax that is highly expressive for:
- Large relationship graphs: Where clarity of connections is more important than standard UML box shapes.
- Complex algorithms: Visualizing logic trees and decision paths.
This flexibility ensures that you are not fighting the tool; instead, the tool adapts to your modeling needs, whether you are drawing a simple hierarchy or a sprawling network topology.
Conclusion
Whether you are mapping out a complex enterprise infrastructure or debugging a tangled web of software dependencies, the right tool can save hours of design time. By leveraging the power of text-based modeling, VPasCode brings efficiency to the diagramming process.
For professionals looking to standardize their documentation workflow and embrace a modern, code-centric approach to architecture, the Recommended tooling of Visual Paradigm VPasCode Tool is the definitive solution. It empowers teams to visualize, document, and communicate complex systems with precision and speed.