


Designing robust real-time systems requires precise understanding of temporal relationships between components. While sequence diagrams illustrate the logical flow of messages, they often fall short when time constraints become critical. This is where the UML Timing Diagram becomes indispensable for system architects. It provides a specialized view of how objects interact over time, focusing on state changes and timing constraints.
In this guide, we explore the mechanics of modeling interrupt handling and asynchronous triggers within this notation. These concepts are vital for embedded systems, safety-critical applications, and distributed architectures where latency and concurrency dictate success.
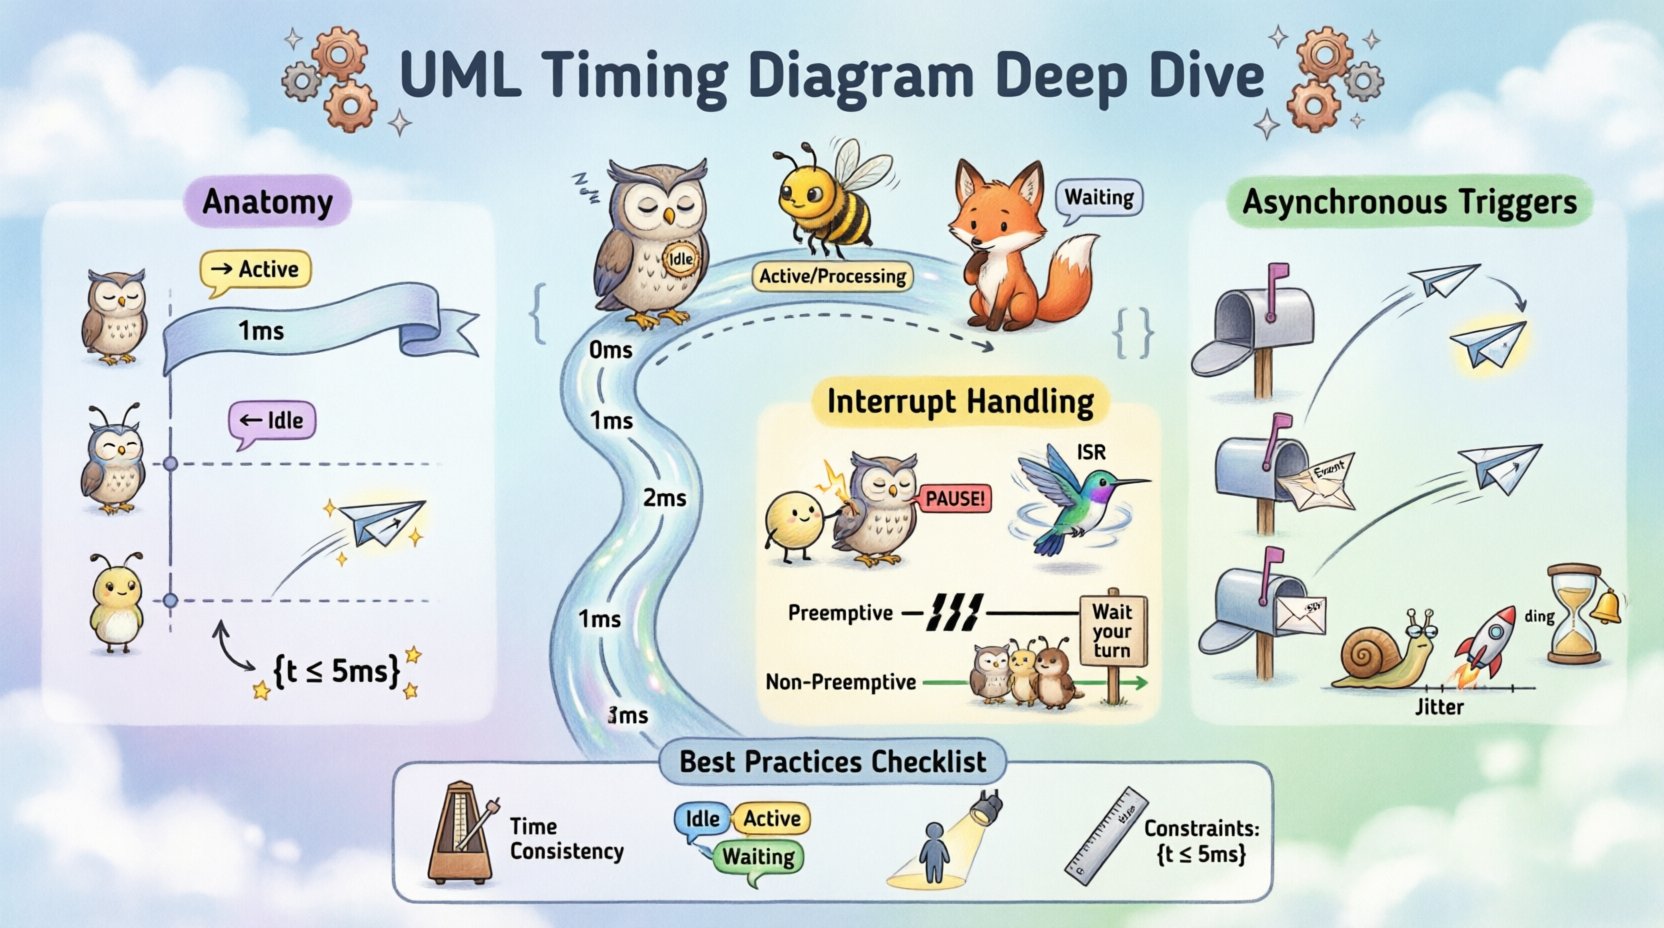
🔍 Anatomy of the Timing Diagram
Before diving into complex interactions like interrupts, it is essential to understand the foundational elements. A timing diagram visualizes the behavior of objects or lifelines over a specific duration.
- Lifelines: Vertical lines representing the existence of an object or component. Time progresses downwards.
- Time Axis: A horizontal axis representing the timeline, often marked with units such as milliseconds or clock cycles.
- State Specification: Rectangular areas along the lifeline indicating the state of the object at a given time (e.g., Active, Inactive, Sleeping).
- Messages: Arrows crossing lifelines indicating the transmission of signals or method calls.
- Constraints: Text enclosed in braces
{...}specifying timing requirements or conditions.
Unlike other UML diagrams, the timing diagram is explicitly temporal. It does not merely show *what* happens, but *when* it happens relative to other events.
⚙️ Modeling Interrupt Handling
Interrupts are external signals that temporarily halt the normal flow of execution to handle a high-priority event. In timing diagrams, representing these requires clear distinction between the pre-empted task and the interrupt service routine.
1. Types of Interrupts
Understanding the nature of the interrupt is crucial for accurate modeling. We generally categorize them into two main types:
- Hardware Interrupts: Triggered by physical events (e.g., a sensor signal, network packet arrival).
- Software Interrupts: Triggered by internal events (e.g., division by zero, timer expiration).
2. Visual Representation
To depict an interrupt, the diagram must show the suspension of the current process. This is achieved through specific visual cues:
- Activation Bars: The current process bar is interrupted by a spike or a shift to a different activation bar representing the interrupt handler.
- Priority Levels: Labels indicating which thread or process holds the CPU at any given moment.
- Return Points: Clear indication of where execution resumes after the interrupt is serviced.
3. Preemptive vs. Non-Preemptive
The timing diagram helps clarify the scheduling strategy. In a preemptive system, the diagram shows a hard break in the lower-priority task. In a non-preemptive system, the interrupt request is queued until the current task voluntarily yields control.
| Feature | Preemptive Interrupt | Non-Preemptive Interrupt |
|---|---|---|
| Response Time | Immediate | Deferred until yield |
| Context Switch | Required | Not always required |
| Diagram Complexity | High (Multiple activations) | Lower (Single activation) |
| Use Case | Real-time control loops | Batch processing |
📡 Asynchronous Triggers and Signals
Asynchronous triggers occur when a sender does not wait for a receiver to be ready. This is common in event-driven architectures. The timing diagram is the ideal tool to visualize the latency between the trigger and the response.
1. The Nature of Asynchrony
In a synchronous call, the caller waits for a return value. In an asynchronous trigger, the caller sends a signal and continues. The diagram reflects this by showing the message arrow ending without an immediate return arrow.
- Fire-and-Forget: The message is sent, and the sender proceeds immediately.
- Event Queueing: The receiver processes the event later, which may be shown as a delay in the receiver’s activation bar.
- Callbacks: A subsequent message returns to the sender after the asynchronous task completes.
2. Modeling Latency
One of the primary reasons to use a timing diagram is to analyze latency. When modeling asynchronous triggers, specific attention must be paid to the time delta between the event generation and the handler execution.
- Jitter: Variability in the time it takes for the trigger to be processed.
- Throughput: The volume of asynchronous events the system can handle within a time window.
- Timeouts: If a response is not received within a set time, the diagram should indicate a timeout state.
🔄 Combining Interrupts and Asynchronous Triggers
Complex systems often involve both mechanisms simultaneously. A hardware interrupt might trigger a software event, which then queues an asynchronous task. Modeling this interaction requires careful layering of lifelines.
1. The Interrupt Stack
When an interrupt occurs during an asynchronous operation, the timing diagram must show the nesting. The current asynchronous task is paused, the interrupt handler runs, and then the original task resumes.
This scenario highlights potential race conditions. If two interrupts occur in quick succession, the diagram helps verify if the system has the capacity to handle the stack depth without overflow.
2. Concurrency and Shared Resources
Asynchronous triggers often access shared resources. If an interrupt modifies a resource while an asynchronous task is reading it, data corruption can occur. The timing diagram can illustrate lock acquisition and release times.
- Locking: Show the duration the resource is held.
- Blocking: Show when a task waits for a lock.
- Priority Inversion: Depict scenarios where a low-priority task holds a lock needed by a high-priority interrupt.
🛠 Best Practices for Timing Diagrams
Creating effective timing diagrams requires discipline. Clarity is more important than exhaustive detail in every instance.
- Time Scale Consistency: Ensure the time axis is consistent across the diagram. Zooming in on specific segments is acceptable, but global context matters.
- State Clarity: Use distinct colors or shading for different states (e.g., Idle, Processing, Waiting).
- Minimal Lifelines: Do not include every object in the system. Focus only on those involved in the timing relationship being analyzed.
- Constraint Notation: Use
{t <= 5ms}syntax to define hard deadlines clearly.
⚠️ Common Pitfalls and Solutions
Even experienced modelers make mistakes when translating temporal logic into diagrams. Below are common issues and how to address them.
| Pitfall | Impact | Solution |
|---|---|---|
| Ignoring Latency | System fails to meet deadlines | Include transmission delay in message arrows |
| Overlapping Lifelines | Confusion on execution order | Use vertical alignment strictly; avoid crossing arrows where possible |
| Vague Constraints | Ambiguity in requirements | Use specific numerical values (e.g., 200ns instead of fast) |
| Missing Interrupts | Hidden latency in critical paths | Explicitly draw interrupt service routines as separate activation bars |
🧪 Verification and Validation
Once the timing diagram is constructed, it serves as a baseline for verification. Engineers can compare the modeled behavior against actual system logs.
- Traceability: Map diagram elements to code functions. Verify that the timing constraints in the diagram match the code implementation.
- Simulation: Use the diagram to simulate worst-case scenarios. What happens if the interrupt frequency doubles?
- Testing: Generate test cases based on the time windows defined in the diagram. Ensure the system behaves correctly within the specified tolerances.
🧠 Advanced Considerations
For highly complex systems, standard timing diagrams may require extension. Consider the following advanced modeling techniques.
1. Hierarchical Timing Diagrams
When a subsystem has its own complex timing behavior, encapsulate it in a sub-diagram. The parent diagram shows the subsystem as a single lifeline with a summary of its timing behavior. This reduces clutter while maintaining detail.
2. Time-Triggered Architectures
In time-triggered systems, actions occur at specific clock cycles regardless of events. The diagram should show a strict grid or clock signal running parallel to the lifelines to indicate these synchronized moments.
3. Energy and Timing
In battery-operated devices, timing directly impacts power consumption. A task running longer consumes more energy. Adding a power consumption axis or annotation to the timing diagram can help optimize for energy efficiency alongside performance.
📝 Summary of Key Concepts
To summarize the critical takeaways from this deep dive:
- Timing Diagrams are the standard for visualizing temporal behavior in UML.
- Interrupts require distinct activation bars to show preemption and context switching.
- Asynchronous Triggers must account for latency and queueing mechanisms.
- Constraints should be explicit and numerical to avoid ambiguity.
- Concurrency issues like race conditions are best identified by overlapping lifelines.
By adhering to these modeling principles, system architects can create a clear blueprint for real-time behavior. This reduces the risk of timing-related defects during the implementation phase. The effort invested in accurate timing diagrams pays off during system integration and debugging.
🚀 Moving Forward
Implementing these diagrams is an iterative process. Start with high-level timing constraints and refine them as the design matures. Collaboration between software engineers and hardware designers is essential, as timing often involves both domains. The diagram acts as the shared language between these groups.
Remember that diagrams are living documents. As the system evolves, the timing diagrams must be updated to reflect new requirements or hardware changes. This ensures that the documentation remains a valid reference for future maintenance and troubleshooting.
Effective modeling of interrupts and asynchronous triggers ensures that your system is not just functionally correct, but temporally robust. This is the foundation of reliable real-time software architecture.