


In the complex world of software architecture and system design, understanding when events occur is just as critical as understanding what events occur. While sequence diagrams map the order of interactions, they often lack the precision required to define strict temporal constraints. This is where the UML Timing Diagram becomes an essential tool. 📊 This guide explores the mechanics, syntax, and strategic application of timing diagrams to visualize real-time system interactions with clarity and precision.
🔍 What is a UML Timing Diagram?
A UML Timing Diagram is a behavioral diagram that shows the behavior of objects in terms of their state over time. It focuses on the conditions of objects and the timing of events. Unlike other diagrams that prioritize interaction order, this model prioritizes the duration and synchronization of actions. It is particularly useful for embedded systems, real-time protocols, and hardware-software interfaces where milliseconds matter. ⏱️
Key characteristics include:
- Time Axis: A horizontal axis representing the passage of time, usually increasing from left to right.
- Lifelines: Vertical lines representing objects or instances.
- State Changes: Markers indicating when an object transitions from one state to another.
- Message Duration: Visual representation of how long a process takes to execute.
🧩 Core Components and Notation
To construct a valid and readable diagram, one must understand the standard notation. Each element serves a specific purpose in defining the temporal logic of the system. 🛠️
1. Lifelines and Time Axis
The foundation of the diagram is the lifeline. In a timing context, these are vertical lines extending downwards. The horizontal axis represents time. This axis can be linear or non-linear depending on the system requirements. For example, a system might have a fast processing phase followed by a slow wait phase. 📉
2. Activation Bars
Activation bars (or execution occurrences) are rectangles placed on the lifeline. They indicate the period during which an object is performing an action or is in control. The width of the bar corresponds to the duration of the activity.
3. State Indicators
Objects often exist in different states (e.g., Idle, Processing, Finished). State changes are marked by small horizontal ticks or lines crossing the lifeline. The label indicates the new state value.
4. Messages and Signals
Messages are horizontal arrows connecting lifelines. In a timing diagram, the arrowhead shows the direction, but the vertical position on the time axis shows when it was sent. The length of the arrow can sometimes imply duration, but distinct bars are preferred for clarity. 📨
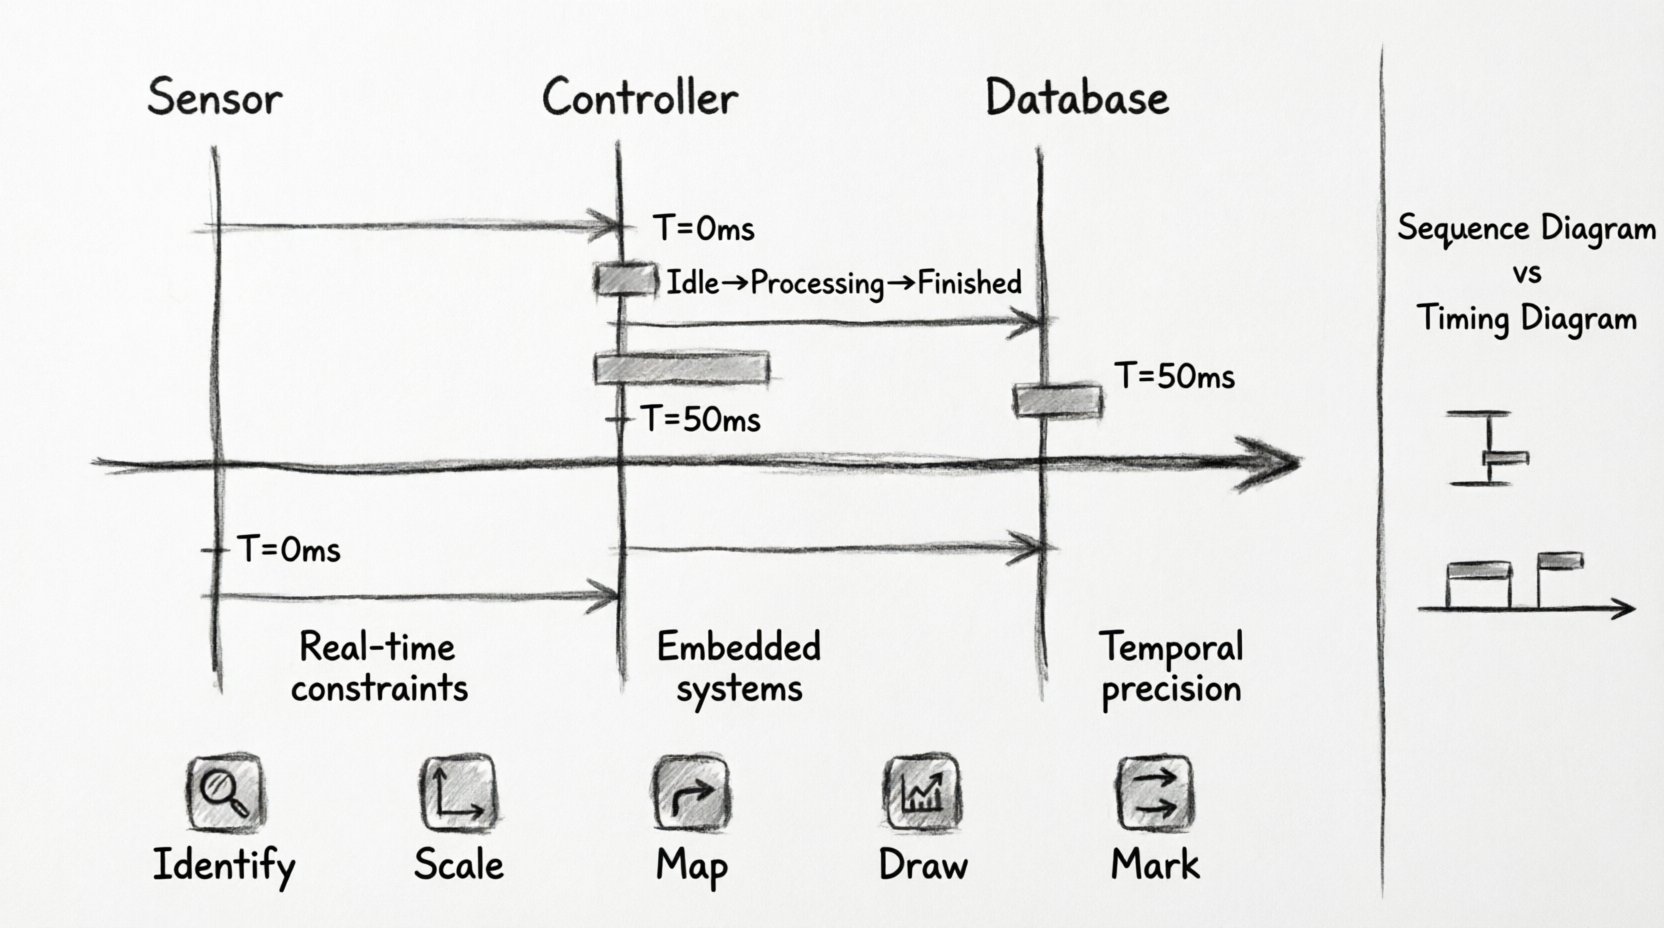
⚖️ Timing Diagram vs. Sequence Diagram
Confusion often arises between Sequence Diagrams and Timing Diagrams. While both show interactions, their focus differs significantly. Understanding the distinction helps in selecting the right tool for the modeling task. 🤔
| Feature | Sequence Diagram | Timing Diagram |
|---|---|---|
| Primary Focus | Order of messages | Timing and duration of actions |
| Time Representation | Implicit (vertical order) | Explicit (horizontal axis) |
| State Focus | Object interaction flow | Object state changes over time |
| Best Used For | Logical flow, user journeys | Real-time constraints, embedded logic |
| Complexity | High on interaction logic | High on temporal precision |
Use a sequence diagram to understand the flow of logic. Switch to a timing diagram when you need to verify that a response happens within 100 milliseconds or that two processes synchronize exactly at a specific point. ⏳
🏗️ Building a Timing Diagram: Step-by-Step Logic
Creating these diagrams requires a logical approach rather than just drawing shapes. Follow this structured process to ensure accuracy. 📝
Step 1: Identify the Objects
Start by listing all the objects involved in the specific interaction scenario. These could be sensors, controllers, databases, or user interfaces. Define the scope clearly to avoid clutter. 🎯
Step 2: Define the Time Scale
Determine the unit of measurement. Is it seconds, milliseconds, or clock cycles? This decision impacts the resolution of the diagram. A microcontroller might require nanoseconds, while a web API might work in seconds. Ensure the scale is consistent throughout. 📏
Step 3: Map the Messages
Place the messages on the horizontal axis according to their start time. If a message is sent at time T=0 and another at T=50ms, place the arrows accordingly. Do not rely on vertical alignment to imply time; use the horizontal position. 📐
Step 4: Draw Activation Bars
For each message received, draw the activation bar on the receiver’s lifeline. The bar must start when the message arrives and end when the processing is complete. This visualizes the processing load. 🖥️
Step 5: Mark State Changes
Indicate when the state of an object changes. For example, a database connection moving from Closed to Open. Place these markers on the lifeline where the transition occurs. 🔀
🚀 Advanced Concepts and Patterns
As systems grow in complexity, basic diagrams may not suffice. Advanced patterns allow for deeper analysis of concurrent and nested behaviors. 🧠
1. Concurrency and Parallelism
Real-time systems often handle multiple tasks simultaneously. You can represent parallel lifelines to show that two objects are active at the same time. This is crucial for multi-threaded applications or distributed systems where tasks do not block each other. ⚙️
2. Nested Lifelines
Sometimes an object is composed of sub-objects. You can nest lifelines to show the internal timing of a component. This helps in debugging internal bottlenecks without losing the context of the parent system. 🪆
3. Guard Conditions
Messages often depend on conditions. For example, a message is only sent if isReady == true. While timing diagrams focus on time, guard conditions can be noted near the message arrow to clarify logical prerequisites. ✅
4. Signal vs. Message
Distinguish between synchronous messages and asynchronous signals. Signals are fire-and-forget. In timing diagrams, this is often shown by a specific arrow style or by noting the lack of a return activation bar. 📡
📋 Best Practices for Readability
A diagram that is too complex defeats its purpose. Adhering to best practices ensures the model remains useful for stakeholders and developers. 📚
- Keep it Focused: Do not try to model the entire system in one diagram. Break it down by subsystem or specific use case.
- Consistent Scaling: Ensure the time axis is consistent. Do not stretch one section and compress another unless explicitly noted.
- Clear Labels: Every activation bar and state change should have a clear label. Avoid ambiguous text.
- Limit Lifelines: If there are too many objects, consider grouping them or splitting the diagram into multiple views.
- Use Comments: Add notes for complex timing constraints that are difficult to draw directly. This keeps the diagram clean. 💡
❌ Common Mistakes to Avoid
Even experienced modelers can fall into traps when working with time-based diagrams. Being aware of these pitfalls saves time during the review process. 🚫
- Ignoring Latency: Focusing only on the send time but ignoring the network or processing delay.
- Mixing Units: Using milliseconds for one part and seconds for another without clear demarcation.
- Overcrowding: Placing too many messages on a single lifeline, making it unreadable.
- Ignoring State: Focusing only on messages and forgetting to track the state of the objects involved.
- Incorrect Synchronization: Drawing parallel lines that imply synchronization when they are actually independent. ⚠️
🛠️ Practical Application Scenarios
Where exactly do these diagrams shine in a professional environment? Here are common use cases where precision is non-negotiable. 🏭
1. Embedded Systems
Microcontrollers often have strict timing requirements for sensor reading and actuation. A timing diagram helps verify that the interrupt handler completes within the required cycle time. ⚡
2. Communication Protocols
Protocols like I2C or SPI have specific timing windows for clock and data lines. Modeling these ensures the software driver aligns with the hardware specification. 🔌
3. API Latency Analysis
For high-frequency trading or real-time gaming, the latency between request and response must be minimized. Timing diagrams help visualize where the bottleneck occurs in the chain. 🎮
4. State Machine Verification
When an object has a complex state machine, timing diagrams show the transition paths and the time taken to move between states. This prevents deadlocks caused by timing errors. 🔄
🔗 Integrating with Other UML Models
Timing diagrams do not exist in isolation. They complement other diagrams to provide a complete picture of the system architecture. 🧩
- State Machine Diagrams: Use timing diagrams to verify the transitions defined in the state machine occur within expected timeframes.
- Activity Diagrams: Use activity diagrams for high-level flow and timing diagrams for detailed temporal analysis of specific activities.
- Component Diagrams: Use component diagrams to define the physical structure and timing diagrams to define the interaction behavior between them.
💡 Final Thoughts on Temporal Modeling
Creating a UML Timing Diagram requires patience and attention to detail. It is not merely about drawing lines; it is about defining the rhythm of the system. By mastering the visual language of time, you ensure that the architecture meets both functional and non-functional requirements. 🎵
Remember, the goal is clarity. If the diagram confuses the reader, it fails its purpose. Always test your models against real-world data if possible. Adjust the scale and labels until the timing constraints are unambiguous. This discipline leads to robust, reliable systems that perform exactly as intended under pressure. 🏆
As you continue to design, keep this guide in mind. Use the components, follow the steps, and avoid the common pitfalls. With practice, visualizing real-time interactions will become a natural part of your modeling workflow. Happy diagramming! 🚀