


Understanding the behavior of a system requires more than just a list of functions. It demands a visual representation of the flow. The Unified Modeling Language (UML) Activity Diagram serves this purpose perfectly. It models the dynamic aspects of a system, focusing on the flow of control and data from one activity to another. For system analysts and software architects, mastering the notation is essential for clear communication among stakeholders. This guide provides a detailed breakdown of the symbols required to construct accurate and meaningful diagrams.
🔍 The Foundation: Core Elements
Every activity diagram begins with specific entry and exit points. These anchors define the lifecycle of the process being modeled. Without them, the diagram lacks context regarding how a sequence initiates or terminates.
1. Initial Node (Start Point)
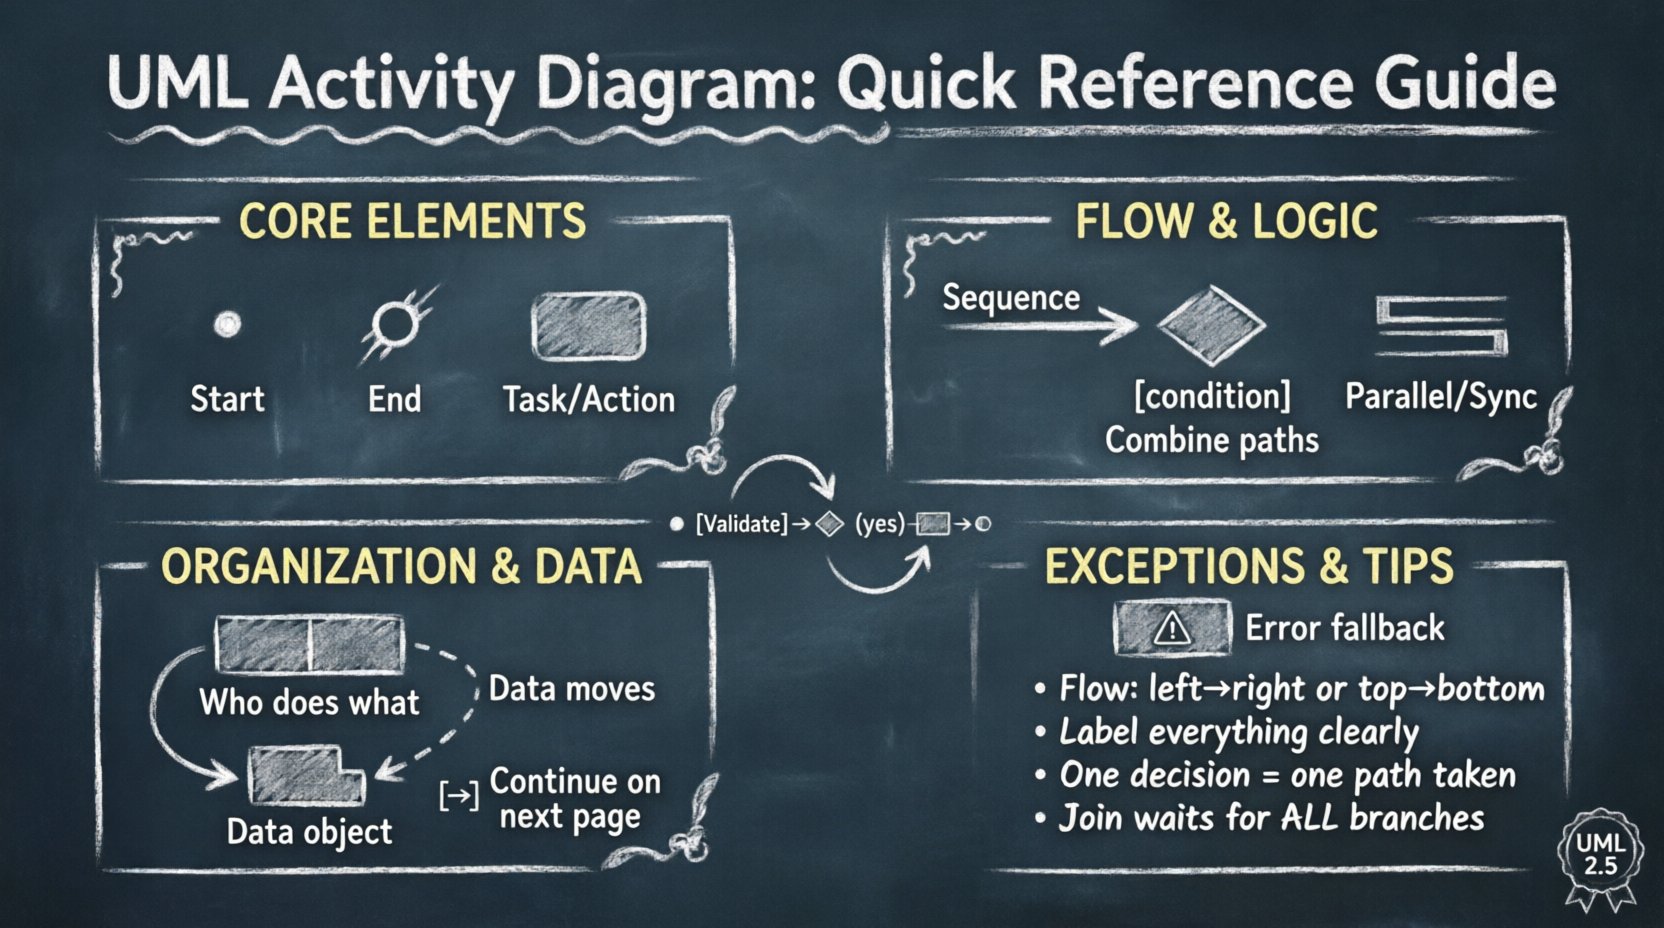
The initial node represents the starting point of the activity flow. It is depicted as a solid black circle. There is typically only one initial node per activity diagram. This symbol indicates where the control flow originates. It has no incoming edges, only outgoing edges. When an action is triggered, execution begins at this node and moves along the defined control flow.
- Shape: Solid black circle.
- Function: Marks the entry point.
- Usage: Always placed at the top or far left of the diagram.
2. Final Node (End Point)
The final node signifies the termination of the activity flow. It is shown as a solid black circle surrounded by a thicker black ring. A diagram can contain multiple final nodes if the process has different termination conditions. For example, a process might end successfully or end due to an error. Each final node indicates a distinct end state for the system.
- Shape: Filled circle within a ring.
- Function: Marks the completion of the process.
- Usage: Placed at the conclusion of paths.
3. Activity State
Activities represent the actual work being performed. They are drawn as rounded rectangles. Inside the rectangle, the name of the action is written. If the action is complex, it may be further decomposed into sub-activities. This level of detail helps in understanding the granularity of the process.
- Shape: Rounded rectangle.
- Function: Represents a task or operation.
- Usage: Connected by control flows.
🔄 Control Flow and Logic
Control flow defines the order in which activities are executed. It connects nodes and dictates the movement of control from one step to the next. Understanding these connectors is vital for depicting logic accurately.
4. Control Flow (Arrow)
Control flow is represented by a directed line with an arrowhead. It indicates the sequence of execution. The arrow points from the source node to the target node. In standard diagrams, control flow implies sequential execution unless otherwise specified. It is the primary mechanism for linking activities.
- Visual: Line with an arrowhead.
- Direction: Source to Target.
- Logic: Sequential dependency.
5. Decision Node
Decision nodes introduce branching logic into the flow. They are represented by a diamond shape. A decision node has one incoming control flow and multiple outgoing flows. Each outgoing flow is labeled with a guard condition, enclosed in square brackets. These conditions determine which path the control takes. Only one path can be taken at a time based on the evaluation of the condition.
- Shape: Diamond.
- Condition: Guard expression (e.g., [is valid]).
- Logic: Exclusive choice between paths.
6. Merge Node
A merge node combines multiple incoming flows into a single outgoing flow. It is also drawn as a diamond. Unlike a decision node, a merge node does not evaluate conditions. It simply waits for control to arrive from any of the incoming paths. It is often paired with a decision node to ensure the flow converges after branching.
- Shape: Diamond.
- Function: Combines paths.
- Logic: Convergence of branches.
7. Fork and Join Nodes
Complex systems often require parallel processing. Fork and join nodes handle concurrency. A fork node splits a single control flow into multiple parallel flows. It is represented by a thick horizontal bar. A join node merges these parallel flows back into a single flow. It is also represented by a thick horizontal bar. The join node waits for all incoming branches to complete before proceeding.
- Fork Shape: Thick bar (horizontal).
- Join Shape: Thick bar (horizontal).
- Function: Parallel execution and synchronization.
- Logic: Concurrency management.
🏊 Organizational Structure: Swimlanes
As diagrams grow in complexity, it becomes difficult to see who is responsible for which action. Swimlanes provide a way to organize activities by responsibility. They divide the diagram into parallel tracks.
8. Swimlanes
Swimlanes are partitioned regions of the diagram. They can be vertical or horizontal. Each lane represents a specific actor, role, department, or system component. Activities placed within a lane are performed by that specific entity. This separation clarifies the handover points between different parties.
- Visual: Divided regions labeled at the top or side.
- Function: Separation of concerns.
- Benefit: Identifies ownership and handovers.
9. Page References
When an activity diagram becomes too large for a single page, page references are used. These are small rectangles with a specific icon. They indicate that the flow continues on a different page. A page reference at the end of a path points to the start of the corresponding reference on the other page. This maintains continuity across multiple documents.
- Visual: Small rectangle with page icon.
- Function: Navigation between pages.
- Usage: Managing diagram size.
📦 Object Flow and Data
Control flow is not the only type of movement in a system. Data and objects also move between activities. Object flow tracks the lifecycle of data throughout the process.
10. Object Flow
Object flow is similar to control flow but represents the movement of data objects rather than control. It is drawn as a dashed line with an arrowhead. Objects can be created, modified, or consumed at specific activity states. This helps in visualizing data dependencies.
- Visual: Dashed line with arrowhead.
- Function: Data movement tracking.
- Logic: Input/output dependencies.
11. Object Nodes
Object nodes represent the existence of an object at a specific point in time. They are drawn as rectangles with a folded corner, similar to a document icon. Objects can be pinned to an activity to show that they are input or output. A pin is a small rectangle attached to the boundary of an activity.
- Visual: Rectangle with folded corner.
- Function: Data container.
- Usage: Showing data creation or consumption.
⚠️ Exception Handling
Systems rarely run without issues. Exceptions must be modeled to ensure robustness. Exception handlers allow the diagram to show what happens when an error occurs.
12. Exception Handler
An exception handler is a region that catches exceptions raised by activities within it. It is drawn as a rectangle with a specific label indicating it is a handler. If an activity inside the handler region fails, the control flow transfers to the exception handling logic rather than terminating the entire process.
- Visual: Rectangle labeled as handler.
- Function: Error management.
- Logic: Fallback execution paths.
📋 Comprehensive Symbol Reference
For quick access, refer to this table summarizing the key notations discussed above.
| Symbol Name | Visual Representation | Primary Purpose |
|---|---|---|
| Initial Node | Solid Black Circle | Process Entry Point |
| Final Node | Filled Circle with Ring | Process Termination |
| Activity State | Rounded Rectangle | Task Execution |
| Control Flow | Solid Line + Arrow | Sequential Flow |
| Decision Node | Diamond | Branching Logic |
| Fork/Join | Thick Bar | Concurrency |
| Swimlane | Partitioned Region | Responsibility Separation |
| Object Flow | Dashed Line + Arrow | Data Movement |
| Object Node | Folded Corner Rectangle | Data Object |
| Exception Handler | Rectangle with Label | Error Handling |
🛠 Design Guidelines and Best Practices
Creating a diagram is not just about placing symbols correctly. It requires adherence to design principles that ensure readability and maintainability. A cluttered diagram is useless, regardless of the accuracy of the logic.
1. Keep it Simple
Avoid cramming too many activities into a single diagram. If a process is complex, break it down into sub-activities or separate diagrams. Use page references to maintain logical continuity without overcrowding the view. Simplicity aids in comprehension.
2. Consistent Flow Direction
Establish a standard direction for control flow. Reading from left to right or top to bottom is standard practice. Avoid crossing lines unnecessarily. Crossing lines create visual noise and make the diagram harder to follow.
3. Clear Labeling
Every node and flow should have a clear label. For decision nodes, guard conditions must be concise. Avoid vague terms like “process data.” Use specific terms like “Validate User Input.” Specificity reduces ambiguity.
4. Minimize Cross-References
While page references are necessary for large diagrams, excessive cross-referencing makes navigation difficult. Keep related activities close together whenever possible. This reduces the cognitive load required to trace the flow.
5. Standardize Swimlanes
Ensure swimlanes are clearly labeled. Do not mix roles within a single lane. If a process involves multiple systems, dedicate specific lanes to each system. This visual separation highlights integration points.
🔗 Integrating with Other Diagrams
Activity diagrams do not exist in isolation. They interact with other UML diagrams to provide a complete system view. Understanding these relationships helps in context building.
Relationship with Class Diagrams
Activities often manipulate objects defined in class diagrams. The inputs and outputs of an activity can be linked to class attributes. This ensures that the data flow matches the data structure.
Relationship with State Machine Diagrams
State machine diagrams focus on the state of an object, while activity diagrams focus on the process. They can be combined where a specific state triggers an activity. This hybrid approach is useful for complex workflows.
🚧 Common Pitfalls to Avoid
Even experienced modelers make mistakes. Being aware of common errors helps in producing higher quality diagrams.
- Dangling Arrows: Every arrow must connect to a valid node. An arrow ending in empty space is invalid.
- Deadlocks: Ensure that join nodes do not create deadlocks. A join requires all incoming paths to be completed.
- Infinite Loops: While loops are valid, ensure they have a clear exit condition. Unbounded loops can confuse the reader.
- Overlapping Lanes: Swimlanes should not overlap. Overlap creates ambiguity about ownership.
- Missing Labels: Unlabeled flows make it impossible to understand the logic of decision nodes.
🎯 Summary of Key Concepts
The UML Activity Diagram is a powerful tool for modeling system behavior. By utilizing the correct symbols, you can convey complex logic clearly. The initial and final nodes anchor the process. Control flows dictate the sequence. Decision nodes introduce logic. Fork and join nodes manage concurrency. Swimlanes organize responsibility. Object flows track data.
Adhering to design guidelines ensures that the diagram remains a useful artifact throughout the system lifecycle. It serves as a blueprint for developers and a reference for stakeholders. Accuracy in notation translates to accuracy in implementation. Focus on clarity and consistency above all else.
Regularly review your diagrams against the standard notation. Verify that every symbol serves a purpose. Remove unnecessary elements. A clean diagram is a professional diagram. Use this reference guide as a foundation for your modeling efforts.