


When modeling complex business processes or software workflows, clarity is paramount. The Unified Modeling Language (UML) provides a standardized way to visualize system behavior. Among the various diagram types available, the Activity Diagram stands out for its ability to show the flow of control and data. However, the landscape of activity diagrams is not monolithic. Different shapes and structures serve distinct purposes depending on the complexity of the system being modeled. This guide explores the nuances of these diagrams, helping you select the appropriate structure for your specific requirements.
🔍 Understanding the Purpose of Activity Diagrams
An activity diagram describes the dynamic nature of a system by modeling the flow of control from activity to activity. It is often used to describe the business processes or the detailed logic of a use case. Unlike a class diagram which focuses on structure, an activity diagram focuses on behavior over time. It is particularly useful for:
- Visualizing the sequence of operations in a system.
- Identifying bottlenecks in a workflow.
- Clarifying the responsibilities of different actors or roles.
- Describing the logic of complex algorithms.
Choosing the right shape ensures that the diagram communicates the intended message without ambiguity. Using a simple linear flow for a parallel process will confuse stakeholders. Conversely, using a complex parallel structure for a simple task adds unnecessary cognitive load. The selection depends on the concurrency, decision points, and organizational needs of the process.
🏗️ Core Components and Shapes
Before diving into specific types, it is essential to understand the fundamental building blocks. Every activity diagram is constructed from a set of standard nodes and edges.
1. Activity Nodes
An activity node represents a phase of work. It is typically drawn as a rounded rectangle. Inside, you describe the action being performed. This can range from a single method call in code to a high-level business step like “Approve Loan”.
2. Control Flow Edges
Control flows connect activity nodes. They represent the sequential passing of control. An arrowhead indicates the direction of the flow. This is the backbone of the diagram, showing what happens next.
3. Object Flows
Unlike control flows, object flows represent the movement of data or physical objects. An object node is a small rectangle, and the flow is a dashed line. This is crucial when tracking the state of data through the process.
4. Decision and Merge Nodes
Decision nodes are diamonds that branch the flow based on a condition. Merge nodes bring multiple flows back together. They are essential for modeling logic and branching paths.
⚖️ Sequential vs. Parallel Structures
The most significant distinction in activity diagrams lies in how tasks are ordered. This determines whether you use a simple sequence or a concurrent structure.
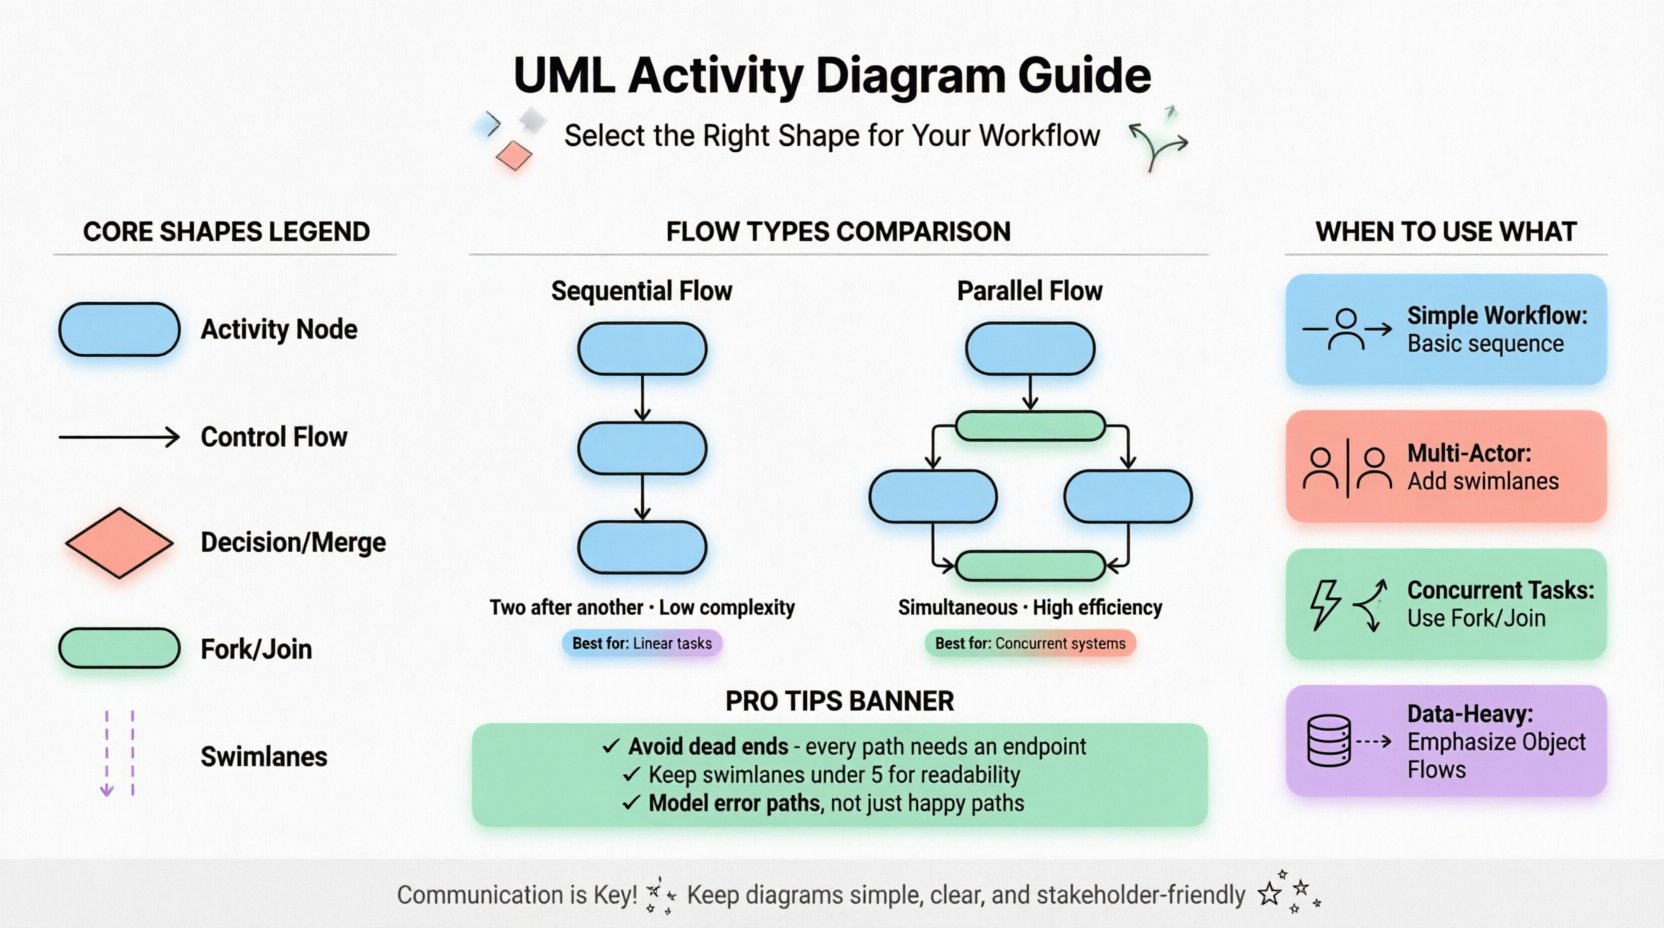
Sequential Flow
In a sequential model, one activity must finish before the next begins. This is the standard flow for linear processes.
- Use Case: A user registration process where email validation must occur before account creation.
- Visual Shape: A straight line of activity nodes connected by control flows.
- Benefit: Easy to read and understand. Low cognitive overhead.
Parallel Flow (Fork and Join)
Parallel execution allows multiple activities to happen simultaneously. This is modeled using Fork and Join nodes.
- Fork Node: A thick horizontal or vertical bar that splits one control flow into multiple concurrent flows.
- Join Node: A thick bar that waits for all incoming concurrent flows to complete before continuing the single outgoing flow.
- Use Case: An e-commerce checkout where payment processing and inventory reservation happen at the same time.
- Benefit: Accurately represents systems that can utilize multiple resources or threads simultaneously.
Comparison of Flow Types
| Feature | Sequential Flow | Parallel Flow |
|---|---|---|
| Execution Order | One after another | Simultaneous |
| Complexity | Low | High |
| Resource Usage | Single resource | Multiple resources |
| Key Shapes | Activity Nodes | Fork, Join, Activity Nodes |
| Best For | Linear processes | Concurrent systems |
🌊 The Role of Swimlanes
When a process involves multiple actors, departments, or system components, a flat diagram becomes a tangled web. Swimlanes solve this by partitioning the diagram into vertical or horizontal strips. Each lane represents a specific responsibility.
Types of Swimlanes
- Participant Swimlanes: Group activities by the role responsible for them (e.g., Customer, Admin, System).
- Class Swimlanes: Group activities by the class or object instance handling the work.
- Functional Swimlanes: Group activities by the department or function (e.g., Sales, Logistics, Support).
When to Use Swimlanes
You should introduce swimlanes when the diagram becomes difficult to follow regarding who is doing what. If a control flow crosses from one side of the page to the other without a clear reason, a swimlane likely clarifies the handoff.
- Clarity: Reduces the need for text labels explaining responsibilities.
- Accountability: Makes it clear which actor owns a specific step.
- Integration: Helps identify handoff points between different systems or teams.
Best Practices for Swimlanes
- Keep the number of lanes manageable. Too many lanes make the diagram wide and hard to view.
- Ensure flows do not cross lanes unnecessarily unless it represents a handoff.
- Use consistent ordering (e.g., top-to-bottom or left-to-right) to guide the reader.
🔀 Decision Nodes and Logic Control
Processes are rarely linear. They involve choices. Decision nodes allow the flow to branch based on a boolean condition or a guard expression.
Single Decision vs. Multiple Guards
A single decision node can have multiple outgoing edges. Each edge should have a guard condition in brackets, such as [Approved] or [Rejected]. The sum of all conditions should cover all possible outcomes to avoid dead ends.
Decision vs. Merge
It is important to distinguish between the Decision node (diamond) and the Merge node (diamond without a tail). A Decision splits one path into many. A Merge brings many paths into one. They are inverses of each other.
Example Scenario
Consider a login system:
- Activity: Enter Password.
- Decision: Is Password Correct?
- Path A: [Yes] → Grant Access.
- Path B: [No] → Show Error Message.
📦 Object Flows vs. Control Flows
Confusion often arises between the flow of control (sequence) and the flow of data (objects). Distinguishing them is vital for data-driven modeling.
Control Flow
Indicates that the activity is ready to start. It is about timing and sequence.
Object Flow
Indicates that an object is created, modified, or consumed. It is about data transformation.
When to Use Object Flows
- When the state of an object changes significantly between steps.
- When you need to track the lifecycle of a specific entity (e.g., an Order object).
- When the output of one activity is the input of another.
🛠️ Selection Criteria: Choosing the Right Type
Selecting the correct diagram structure depends on the problem domain. Below is a guide to help you decide.
Scenario 1: Simple Workflow
If the process is linear and involves a single actor, use a basic sequential activity diagram. Avoid swimlanes or parallel flows to prevent over-complication.
Scenario 2: Multi-Actor Process
If multiple departments or users interact, use swimlanes. This visualizes the handoffs and boundaries between responsibilities clearly.
Scenario 3: Concurrent Tasks
If tasks can happen at the same time (e.g., background processing), use Fork and Join nodes. This accurately models system performance and resource usage.
Scenario 4: Data Heavy Process
If the movement of data is more important than the timing, emphasize Object Flows. Show how data transforms from input to output.
Scenario 5: Complex Logic
If there are many branching paths, use nested decision nodes carefully. Consider breaking the diagram into sub-activities to maintain readability.
🚫 Common Pitfalls to Avoid
Even with the right shapes, errors can occur. Be aware of these common modeling mistakes.
- Dead Ends: Ensure every path leads to a final node. A diagram that stops unexpectedly implies an error in the logic.
- Infinite Loops: While loops are valid, ensure there is a termination condition visible in the diagram. Avoid uncontrolled cycles.
- Overlapping Swimlanes: Do not place activities in multiple swimlanes unless it represents a shared responsibility, which can be confusing.
- Ignoring Exceptions: A robust diagram accounts for error paths. Do not only model the happy path.
- Too Many Levels: If a diagram has too many sub-activities, consider using a composite activity (a sub-process) to hide complexity.
📈 Integration with Other UML Diagrams
An activity diagram does not exist in isolation. It works in tandem with other UML diagrams to provide a complete picture.
Use Case Diagrams
Use Case diagrams show what the system does from a user perspective. Activity diagrams show how the system does it internally. You can link an activity diagram to a use case to detail its implementation.
State Machine Diagrams
State diagrams focus on the state of a single object. Activity diagrams focus on the flow of actions. Use State diagrams for objects that change states frequently (e.g., an Order), and Activity diagrams for processes that involve multiple objects.
Sequence Diagrams
Sequence diagrams show interactions between objects over time. Activity diagrams show the logic driving those interactions. They complement each other well; the activity diagram provides the control logic, while the sequence diagram provides the communication details.
🛡️ Maintenance and Evolution
Processes change. As requirements evolve, your diagrams must adapt. Maintaining activity diagrams requires discipline.
- Version Control: Treat diagrams as code. Track changes to the visual logic.
- Review Cycles: Regularly review diagrams with stakeholders to ensure they match current business rules.
- Documentation: Add notes to explain complex decisions or historical context that isn’t obvious from the shapes.
- Standardization: Define a naming convention for nodes and flows to keep the model consistent across the project.
Final Considerations for Modeling Success
Creating an effective activity diagram is a balance between precision and simplicity. The goal is not to create a visual masterpiece, but to facilitate understanding among the team. By selecting the right shapes—whether it is a simple sequential flow or a complex parallel structure with swimlanes—you ensure that the logic is conveyed accurately.
Remember that the diagram is a communication tool. If a stakeholder cannot understand the flow within a few minutes, the complexity is likely too high. Simplify the shapes, reduce the number of crossing lines, and focus on the critical paths. The right choice of diagram type empowers the team to see the process clearly, identify improvements, and build systems that function as intended.
Whether you are designing a new software feature or mapping a business operation, the principles of activity modeling remain consistent. Focus on the flow of control, the movement of data, and the division of responsibility. With these elements in place, your UML activity diagrams will serve as a reliable blueprint for success.