


System design requires a clear bridge between what users need and how the system behaves. User stories provide the narrative context, capturing the who, what, and why of a feature. However, narrative alone often lacks the precision required for technical implementation. This is where UML activity diagrams become essential. They visualize the workflow, decision points, and parallel processes that define the system’s logic. Translating user stories into these diagrams ensures that developers understand the exact sequence of operations before writing code. This guide details the methodology for converting abstract requirements into concrete visual models without relying on specific tools or platforms.
Understanding the Input: User Stories 📝
Before drawing any shapes or connecting lines, you must fully comprehend the user story. A user story is a brief, informal description of a feature told from the perspective of the person who desires the new capability. It typically follows the format: As a [role], I want [feature], so that [benefit].
To translate this effectively, you need to look beyond the headline. The core of the translation lies in the acceptance criteria. These criteria define the conditions that must be met for the story to be considered complete. They often contain conditional logic, such as “If X happens, then Y must occur.” This conditional logic is the primary candidate for decision nodes in your diagram.
Key elements to extract from a user story include:
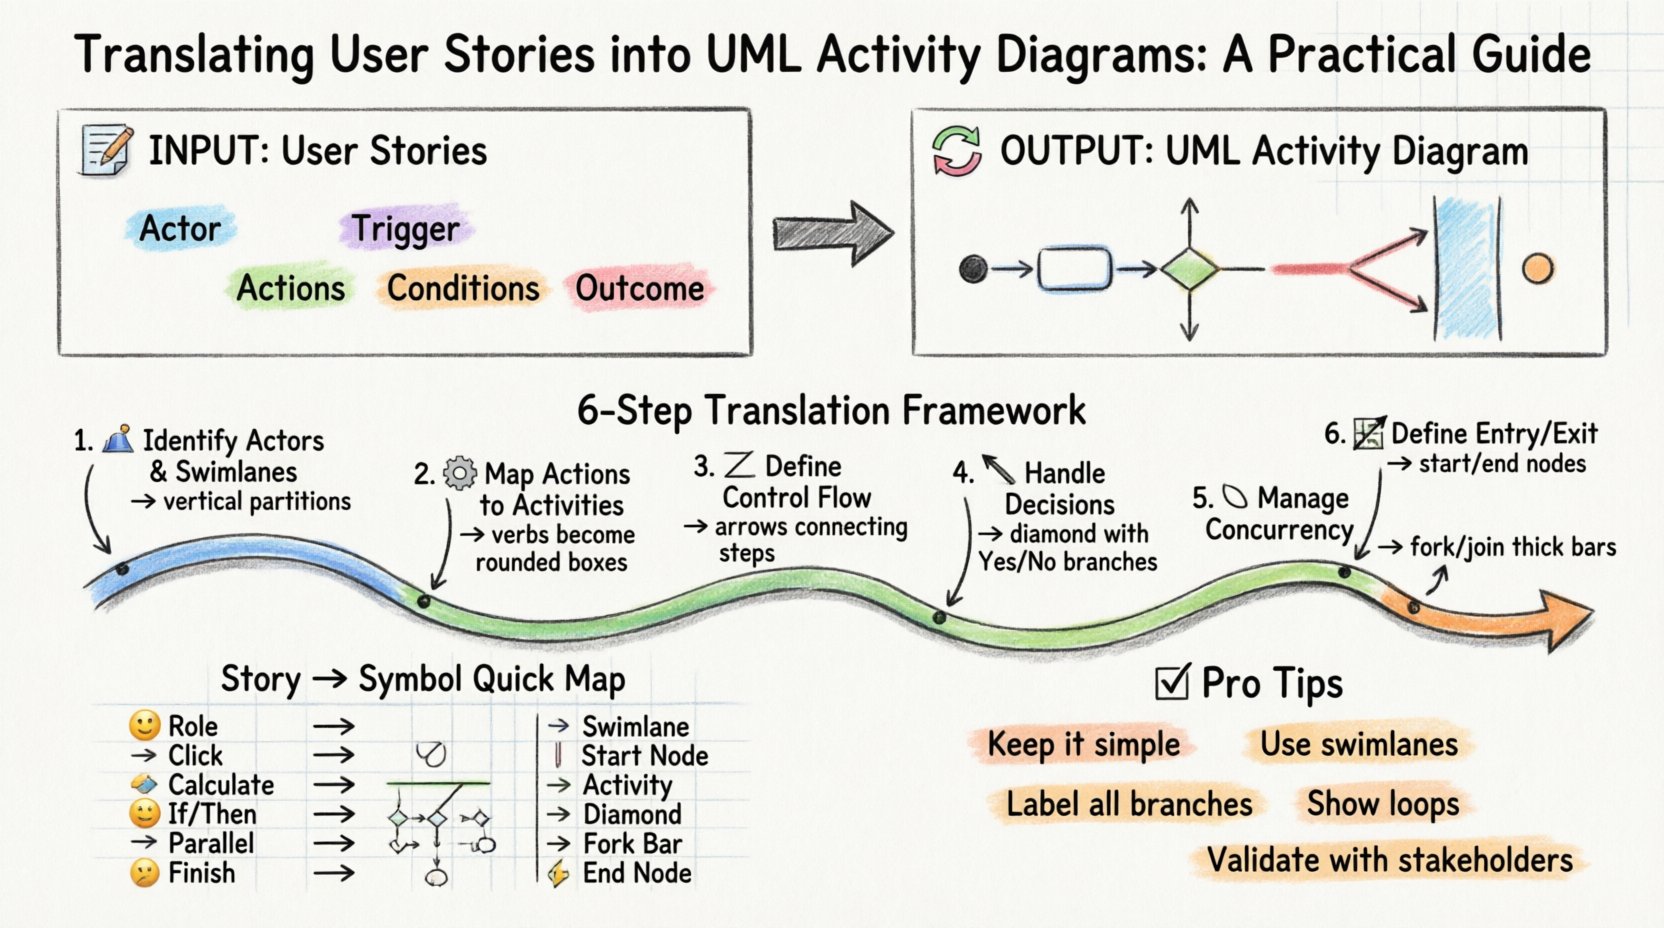
- Actor: Who initiates the process? Is it a customer, an administrator, or an external system?
- Trigger: What event starts the workflow? A button click, a scheduled task, or an API call?
- Actions: What specific steps must the system perform?
- Conditions: Under what circumstances does the flow change direction?
- Outcome: What is the final state of the data or the user interface?
Understanding the Output: UML Activity Diagrams 🔄
An UML activity diagram describes the flow of control from activity to activity. It is similar to a flowchart but includes specific symbols and conventions defined by the Object Management Group. Unlike a class diagram, which shows static structure, an activity diagram shows dynamic behavior.
Key components used in this translation include:
- Activity State: A rounded rectangle representing a step in the process.
- Control Flow: Arrows indicating the order of execution.
- Decision Node: A diamond shape used to branch the flow based on conditions.
- Fork and Join Nodes: Thick bars that allow the process to split into parallel paths or merge them back together.
- Swimlanes: Vertical or horizontal partitions that organize activities by responsible actor or system component.
- Initial Node: A solid black circle marking the start of the flow.
- Final Node: A black circle with a border, marking the end of the flow.
The Translation Framework: Step-by-Step 🛠️
Converting a narrative requirement into a visual model requires a structured approach. Rushing this process often leads to diagrams that are either too complex or too vague. Follow these steps to ensure accuracy and clarity.
Step 1: Identify Actors and Swimlanes 🏊
The first visual decision you make is how to organize the diagram. Swimlanes are used to separate responsibilities. If a user story involves interaction between a user and a database, you might use two lanes: User Interface and Backend Service. If multiple actors are involved, such as a Customer and a Payment Gateway, create a separate lane for each.
Start by listing every actor mentioned in the story and its acceptance criteria. Assign each actor a dedicated swimlane. This immediately clarifies ownership. It answers the question: Who does what?
Step 2: Map User Actions to Activities ⚙️
Scan the acceptance criteria for verbs. Verbs often represent activity states. For example, “The system must validate the email address” becomes an activity node labeled Validate Email.
- Simple Actions: Map directly to activity states.
- Complex Actions: If an action is complex, it may need to be broken down into sub-activities. However, keep the high-level diagram focused on the main flow.
- System Responses: Distinguish between actions the user takes (e.g., “Click Submit”) and actions the system takes (e.g., “Process Payment”).
Step 3: Define Control Flow 🔗
Once activities are placed in their respective swimlanes, connect them using control flow arrows. The arrow direction represents the sequence of execution. Start from the Initial Node in the primary swimlane (usually the one representing the user or the trigger).
Ensure that every activity has a path leading to the next logical step. Avoid disconnected nodes, as these represent dead ends in the logic that will confuse developers. If a process branches, ensure all branches eventually converge or terminate properly.
Step 4: Handling Decisions and Branches 🚦
Acceptance criteria often contain “if-then-else” logic. For instance, “If the user has a valid coupon, apply the discount; otherwise, charge full price.” This requires a Decision Node.
- Input: One incoming arrow from the previous activity.
- Output: Two or more outgoing arrows, each labeled with the condition (e.g., “True”, “False”, “Valid”, “Invalid”).
- Placement: Position the decision node immediately after the activity that generates the condition data.
Do not place conditions on the arrows themselves unless they are simple guard clauses. For complex logic, a diamond node provides better clarity.
Step 5: Managing Concurrency 🔄
Some processes happen simultaneously. For example, “While the file is uploading, the user can continue browsing.” This requires a Fork Node.
- Fork: Represents the splitting of a single flow into multiple concurrent flows.
- Join: Represents the synchronization point where concurrent flows must complete before the main process continues.
Use these sparingly. Overusing concurrency in activity diagrams can make the flow difficult to trace. Only use them when the parallel execution is critical to the system’s performance or logic.
Step 6: Defining Entry and Exit Points 🏁
Every activity diagram must have a clear start and a clear end. The Initial Node is a filled circle. The Final Node is a filled circle with a surrounding ring.
Ensure that every branch created by a decision node eventually leads to a Final Node. If a user cancels a process, there must be a path leading to termination. Do not leave paths dangling. This ensures the diagram represents a complete lifecycle of the user story.
Mapping Patterns: Story Elements to Diagram Symbols 📐
To speed up the translation process, use the following table as a reference. It maps common requirement phrasing to standard UML symbols.
| Requirement Concept | User Story Phrasing | UML Element | Visual Representation |
|---|---|---|---|
| Actor / Responsibility | “As a [Role], …” | Swimlane | Partitioned area |
| Start Event | “When the user clicks…” | Initial Node | Solid Circle |
| Process Step | “The system calculates…” | Activity State | Rounded Rectangle |
| Condition Check | “If the balance is negative…” | Decision Node | Diamond |
| Branch Label | “…then show error” | Guard Condition | Text on Arrow |
| Parallel Processing | “Simultaneously send email…” | Fork / Join Node | Thick Horizontal Bar |
| Completion | “Process is finished” | Final Node | Circle with Ring |
Common Pitfalls and How to Avoid Them ⚠️
Even experienced analysts make mistakes when modeling. Being aware of common errors helps maintain the quality of the diagram.
1. Over-Complication
A single user story should not result in a diagram that spans five pages. If the model becomes too complex, you are likely modeling too much detail. Focus on the happy path and the major exception paths. Detailed error handling logic can be documented in text or separate diagrams if necessary.
2. Ignoring the Swimlanes
Placing all activities in one big pool makes it hard to see who is responsible for what. Always define swimlanes based on the actors identified in the story. This visual separation is crucial for stakeholder review.
3. Missing Loop Conditions
Activity diagrams are excellent for showing loops. If a story involves “Retry until success,” you must draw a loop back to a previous node. Label the returning arrow clearly with the condition that triggers the loop. Failure to do so implies the process ends after one attempt.
4. Ambiguous Decision Nodes
Every outgoing arrow from a decision node must have a guard condition. If you have two arrows leaving a diamond, label them “Yes” and “No” or specific values. Unlabeled branches create ambiguity during implementation.
5. Inconsistent Flow
Ensure that the direction of flow is consistent. Avoid arrows pointing upwards or downwards arbitrarily unless necessary for layout. While layout is flexible, the logical flow must be clear. If a line crosses another, use a jump (a small arc) to indicate they do not connect.
Validation and Review ✅
Once the diagram is drafted, it must be validated against the original user story. This is not a passive step. Walk through the diagram with the product owner or the business analyst.
- Traceability: Can you trace every activity back to a specific acceptance criterion?
- Completeness: Are all possible outcomes covered? What happens if the internet connection drops? What happens if the database is down?
- Clarity: Can a new developer pick up the diagram and understand the flow without asking questions?
- Consistency: Are the labels consistent with the terminology used in the codebase?
If discrepancies are found, update the diagram immediately. A static diagram that does not match the requirements is worse than no diagram at all.
Advanced Considerations 🧩
As systems grow more complex, simple linear translations may not suffice. Consider these advanced scenarios.
Object Flows vs. Control Flows
Control flows represent the sequence of actions. Object flows represent the movement of data. In a detailed model, you might show an object moving from one activity to another. For example, a Customer Object moves from Verify Identity to Create Account. Use dashed lines for object flows to distinguish them from control flows.
Exception Handling
Real-world systems encounter errors. While the happy path is the priority, a robust diagram accounts for exceptions. Use Exception Handlers or specific decision nodes to route error states. For instance, if a payment fails, the flow should redirect to a Notify User activity rather than crashing.
State vs. Activity
Do not confuse Activity Diagrams with State Machine Diagrams. Activity Diagrams focus on the flow of control and actions. State Machine Diagrams focus on the states of an object and the transitions triggered by events. If your user story describes a long-lived object changing states (like an Order going from Pending to Shipped), a State Machine Diagram might be more appropriate. However, for process flows, stick to Activity Diagrams.
Documentation Standards 📄
For the diagram to be useful, it must be documented properly. Do not rely on the visual alone.
- Legend: Include a legend if you use non-standard symbols or colors.
- Versioning: Label the diagram with a version number. Requirements change, and diagrams must evolve with them.
- Linking: If the diagram is part of a larger document, ensure links to related stories or technical specifications are present.
- Naming: Name activities clearly. Avoid abbreviations that are not universally understood.
Final Thoughts on Modeling 🎯
Translating user stories into UML activity diagrams is a discipline that requires practice and attention to detail. It is not merely about drawing boxes; it is about understanding the logic of the system and communicating it effectively. By following a structured process, utilizing swimlanes, and validating against acceptance criteria, you create a blueprint that guides development with precision.
Remember that the goal is clarity. A diagram that confuses the reader serves no purpose. Keep it simple, keep it accurate, and ensure every line drawn has a reason behind it. This approach leads to better software, fewer bugs, and a smoother development lifecycle.
As you continue to model, you will develop an intuition for which details belong in the diagram and which belong in the text. Trust the process, validate your work, and let the visual model speak for the requirements.