


Understanding the flow of logic within software systems is a fundamental skill for any developer. While code tells the computer what to do, visual models help humans understand the structure and behavior before a single line is written. Among the various modeling techniques available, the UML Activity Diagram stands out as a powerful tool for representing workflows. This guide provides a comprehensive look at activity diagrams, designed specifically for those starting their journey in software design. We will explore the syntax, the semantics, and the practical application of these diagrams without relying on specific commercial tools.
🧠 What is an Activity Diagram?
An activity diagram is a type of behavioral diagram in the Unified Modeling Language (UML). Its primary purpose is to describe the flow of control and data from one activity to another. Think of it as a sophisticated flowchart that goes beyond simple linear steps. It captures the dynamic aspects of a system, showing how actions are sequenced, where decisions are made, and how parallel processes interact.
For a beginner developer, this diagram serves as a blueprint for algorithms and business processes. It bridges the gap between abstract requirements and concrete implementation. By visualizing the logic, you can identify potential bottlenecks, logical errors, or missing conditions before they become bugs in the codebase.
- Behavioral Focus: Unlike structural diagrams that show components, activity diagrams show actions and interactions.
- High-Level to Low-Level: They can represent high-level business processes or detailed algorithmic steps.
- Standardized Notation: Using UML ensures that any developer or stakeholder can read the diagram regardless of their technical background.
🛠️ Core Components and Symbols
To create a valid activity diagram, you must understand the standard symbols used to denote different states and transitions. These symbols form the vocabulary of the diagram. Each shape has a specific meaning regarding how control flows through the system.
1. Initial and Final Nodes
Every process needs a starting point and an ending point. In UML, these are represented by filled circles.
- Initial Node: A solid black circle. This marks the entry point of the activity. Control flows out of this node to the first action.
- Activity Final Node: A circle with a dot inside. This represents the successful completion of the entire activity.
- Flow Final Node: An ‘X’ inside a circle. This indicates that a specific flow has ended without stopping the entire activity, often used to signify an early exit or a specific branch termination.
2. Action Nodes
Actions represent the work being performed. These are the rectangular boxes with rounded corners. Inside the box, you write the specific task, such as “Validate User Input” or “Calculate Total Price.” An action node can represent a single operation or a complex activity that might be broken down further.
3. Decision and Merge Nodes
Logic in software is rarely linear. It involves choices. Diamond shapes are used to represent these branching points.
- Decision Node: A diamond shape. This is where the flow splits based on a condition. For example, if a password is correct, one path is taken; if incorrect, another path is followed. You must label the outgoing edges with the conditions, such as “Yes” or “No”.
- Merge Node: Also a diamond shape, but it combines multiple incoming flows into a single outgoing flow. It does not perform logic; it simply reunites paths that diverged earlier.
4. Fork and Join Nodes
Modern systems often handle multiple tasks at once. Thick black bars are used to manage concurrency.
- Fork Node: A thick horizontal or vertical bar. This splits one incoming flow into multiple parallel outgoing flows. It indicates that the subsequent activities can happen simultaneously.
- Join Node: Also a thick bar. This waits for all incoming parallel flows to complete before allowing the single outgoing flow to continue. It synchronizes the parallel processes.
🔄 Control Flow vs. Object Flow
Understanding the difference between how control moves and how data moves is crucial for accurate modeling. UML distinguishes these using different arrow styles.
| Type | Arrow Style | Purpose | Example |
|---|---|---|---|
| Control Flow | Open Arrow | Shows the sequence of actions and logic. | After step A, step B begins. |
| Object Flow | Line with Arrow | Shows the movement of data or objects between activities. | Data moves from Input to Processing. |
| Pin (Input/Output) | Small Circle | Represents data entering or leaving an action. | Passing a User ID to a function. |
Object flows are often depicted as lines connecting the pins on action nodes. This is essential when modeling data transformation. For instance, an action might take a “Raw String” as input and produce a “Parsed Object” as output. The object flow line connects the output pin of one action to the input pin of another.
🏊 Swimlanes for Organization
As diagrams grow in complexity, they can become a tangled web of lines. Swimlanes provide a way to organize activities by responsibility. A swimlane is a visual container that groups related activities together.
- Vertical Swimlanes: Typically used to separate responsibilities by actor, such as “Customer,” “Server,” or “Database.”
- Horizontal Swimlanes: Used to separate processes by department, system module, or time phase.
- Benefits:
- Clarity on who or what performs an action.
- Identification of handoffs between different systems or roles.
- Reduction of visual clutter by grouping related nodes.
When control flows across a swimlane boundary, it represents a handoff. For example, a user clicking a button (Client Lane) triggers a server request (Server Lane). The line crossing the boundary indicates this interaction.
🚀 Concurrency: Parallel Processing
One of the strongest features of activity diagrams is the ability to model parallelism. In real-world software, tasks often run concurrently. A user might be downloading a file while simultaneously checking for updates.
To model this:
- Create a Fork: Draw a thick bar after the initial activity.
- Define Parallel Paths: Draw multiple outgoing edges from the fork. Each edge leads to a different activity.
- Execute Tasks: These activities run at the same time.
- Use a Join: Draw a thick bar where the paths converge. The system waits for all parallel tasks to finish before proceeding past the join.
It is vital to ensure that every fork has a corresponding join. If paths diverge but never converge, you may create orphaned threads or logic errors in the design. Furthermore, be careful with infinite loops. If a decision node always directs control back to a previous point without a termination condition, the diagram represents an infinite process.
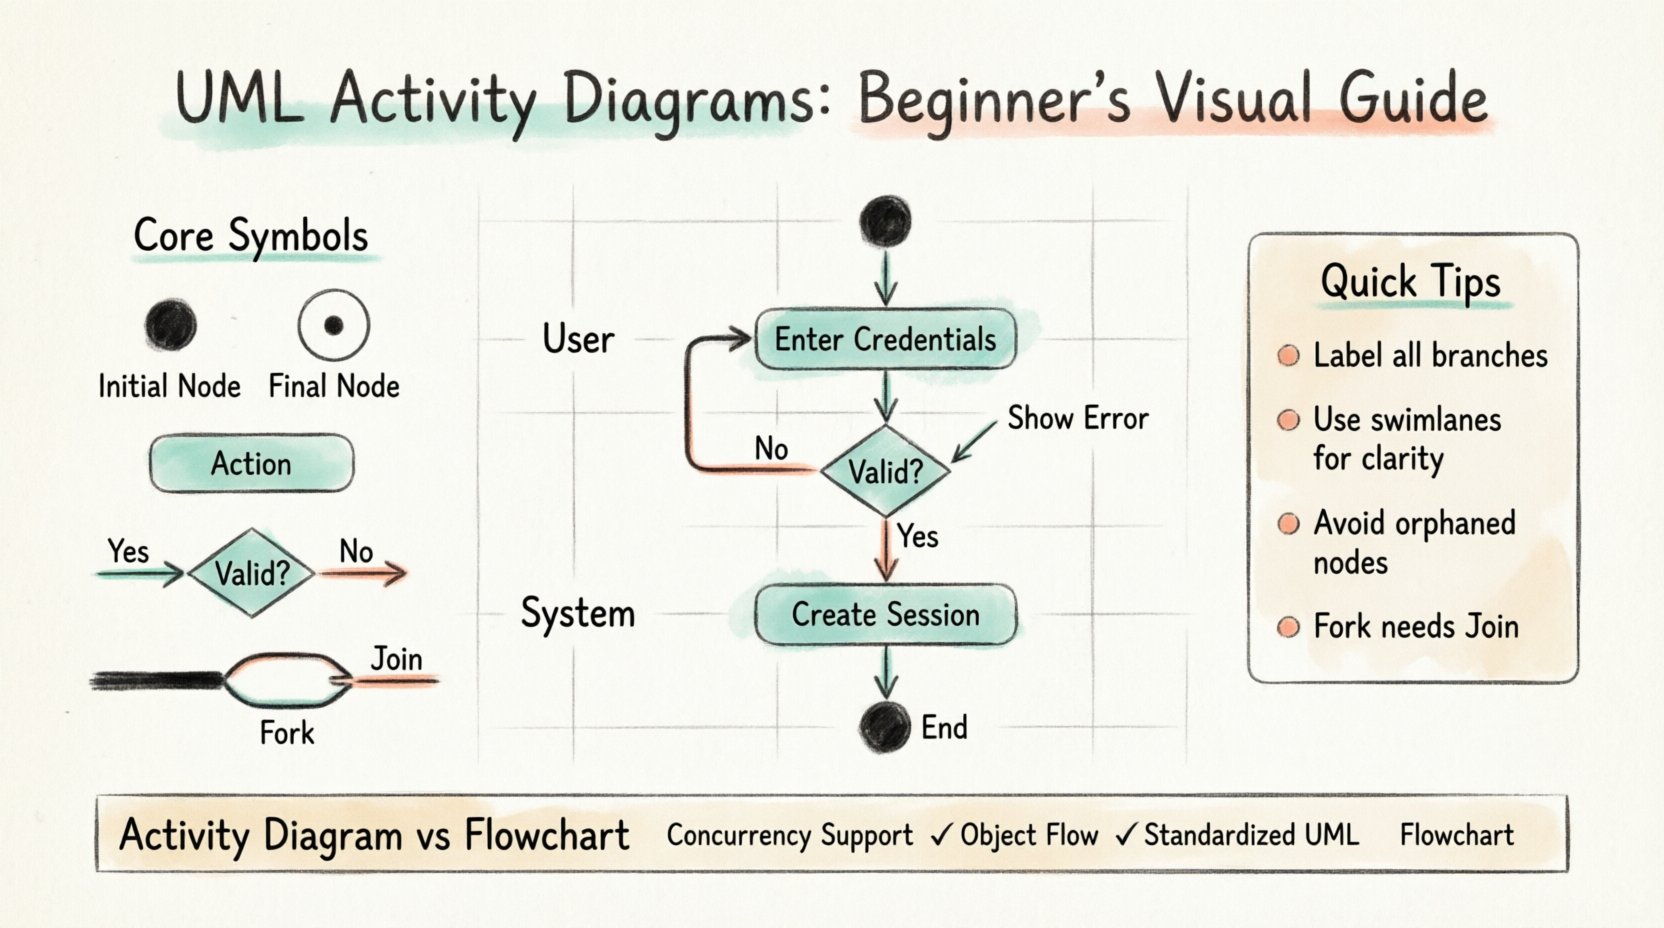
📝 Practical Example: User Login Process
Let us walk through a concrete scenario to solidify these concepts. Consider a standard user login system. This example demonstrates decision nodes, swimlanes, and control flow.
Scenario: A user enters credentials. The system validates them. If valid, the session starts. If invalid, an error is shown.
- Step 1: Initial Node. The process begins when the user opens the login page.
- Step 2: Action (Input Credentials). User enters username and password.
- Step 3: Decision (Validate Credentials). Check database for match.
- Step 4: Branch A (Success). If match found, create session token. Proceed to Dashboard.
- Step 5: Branch B (Failure). If no match, display “Invalid Credentials” message. Allow retry.
- Step 6: Final Node. Session ends or user logs out.
In this diagram, the “Retry” path from the failure branch loops back to the “Input Credentials” action. This loop must be managed carefully to prevent infinite attempts without a lockout mechanism. A swimlane could separate the “User” actions from the “System” actions to make the interaction clear.
⚠️ Common Mistakes to Avoid
Even experienced designers make errors. For beginners, avoiding these common pitfalls is key to producing professional-grade diagrams.
1. Orphaned Nodes
Ensure every action node is reachable from the initial node. If you have a node floating in space with no incoming edges, it is unreachable. Similarly, ensure all paths eventually lead to a final node. Dead ends confuse readers and imply broken logic.
2. Excessive Detail
Do not try to model every single line of code. An activity diagram should capture the logical flow, not the implementation details. If an action is too complex, break it into a sub-activity. Keep the high-level diagram clean.
3. Missing Labels
Decision nodes require labels on the outgoing edges. Without labels like “True” or “False,” the reader cannot understand the condition governing the flow. Always label your branches.
4. Overusing Swimlanes
While swimlanes are useful, too many of them make the diagram wide and hard to read. If you have more than five or six responsibilities, consider splitting the diagram into multiple related diagrams rather than one massive chart.
📊 Activity Diagrams vs. Flowcharts
Beginners often confuse UML Activity Diagrams with traditional flowcharts. While they look similar, there are distinct differences in scope and semantics.
| Feature | Traditional Flowchart | UML Activity Diagram |
|---|---|---|
| Focus | General process logic | Software system behavior |
| Concurrency | Rarely supported | Native support (Fork/Join) |
| Object Flow | Not standard | Explicit data passing support |
| Swimlanes | Used loosely | Strictly defined (Partitioned) |
| Standard | Varies by tool | Standardized by OMG (UML) |
The UML diagram is more rigorous. It is designed specifically for system engineering and software development, whereas flowcharts are a more general business tool. The inclusion of object flow and concurrency makes the UML diagram more suitable for complex technical architectures.
✅ Best Practices for Clarity
To ensure your diagrams are effective communication tools, adhere to these guidelines.
- Consistent Naming: Use the same terminology for actions across different diagrams. If you call it “Get User Data” in one place, do not call it “Retrieve User Info” in another.
- Directional Flow: Arrange the diagram to flow from top to bottom or left to right. Avoid lines crossing each other unnecessarily.
- Use Comments: If a logic path is non-obvious, add a note or comment box to explain the reasoning. This helps future maintainers understand the intent.
- Limit Width: If the diagram spans more than two screens horizontally, it is likely too complex. Consider modularizing the process.
- Review with Stakeholders: Show the diagram to business analysts or peers. If they cannot follow the flow, the diagram needs simplification.
🔗 Integrating with Other UML Diagrams
An activity diagram does not exist in isolation. It is part of a larger ecosystem of UML models.
- Use Case Diagrams: Define the goals. Activity diagrams define the steps to achieve those goals.
- Sequence Diagrams: Sequence diagrams show interactions over time between objects. Activity diagrams show the internal logic of a single method or process. They complement each other well.
- Class Diagrams: Class diagrams define the structure. Activity diagrams define how that structure is used in operations.
By linking these diagrams, you create a complete picture of the system. For example, an activity diagram might trigger a method call, which is detailed in a sequence diagram, operating on objects defined in a class diagram.
🛠️ Creating Diagrams Without Specific Tools
You do not need expensive software to create these diagrams. The principles remain the same regardless of the medium. You can use:
- Paper and Pen: Great for brainstorming and initial sketches. The low fidelity forces focus on logic rather than aesthetics.
- Whiteboards: Useful for team collaboration during design sessions.
- Open Source Software: Various tools exist that support UML standards without licensing fees.
- Text-Based Descriptions: Some developers use structured text to describe the flow before converting to visuals.
The key is to focus on the structure of the information, not the drawing tools. The value lies in the thought process required to build the model.
🌱 Continuous Improvement
As you gain experience, you will find that activity diagrams evolve. You will learn to abstract complex logic into sub-activities to keep diagrams readable. You will learn to identify when a diagram is unnecessary and a simple comment suffices.
Start by modeling small algorithms. Then move to user workflows. Finally, tackle system-level processes. The skill comes with practice. Do not worry about perfection in the first draft. The goal is clarity and communication.
🎯 Summary
UML Activity Diagrams are a critical component of software design documentation. They provide a clear, visual representation of logic, control flow, and concurrency. By mastering the symbols, understanding swimlanes, and avoiding common pitfalls, beginner developers can communicate complex ideas effectively. This visual language reduces ambiguity and helps teams build robust systems. Focus on the logic, maintain consistency, and use these diagrams as a living part of your development lifecycle.
Remember that the diagram is a tool for thinking, not just for documentation. Use it to discover problems before they occur. With practice, you will find that drawing a flow of actions is often the fastest way to write clean, logical code.