


In the complex landscape of software engineering and business process modeling, clarity is currency. When requirements exist only as text, understanding the flow of logic can become a barrier. This is where visual modeling steps in. Specifically, the UML Activity Diagram offers a powerful way to represent workflows, algorithms, and operational sequences. Moving from abstract text to concrete visuals requires a structured approach. This guide walks you through the mechanics, notation, and best practices for creating effective diagrams without relying on specific proprietary tools.
📋 Understanding the Core Purpose
An Activity Diagram is a behavioral diagram. It describes the flow of control and data within a system. Unlike a class diagram, which focuses on structure, this type focuses on behavior. It answers the question: What happens next? It is particularly useful for:
- Describing the operational sequence of a system 🔄
- Modeling business processes from start to finish 🏁
- Visualizing complex logic that involves decision points ⚖️
- Representing concurrency and parallel activities ⚡
When you translate text requirements into a diagram, you are essentially creating a shared language for stakeholders. Developers, analysts, and clients can all look at the same visual representation and understand the system behavior. This reduces ambiguity significantly.
🧩 The Building Blocks of Notation
To draw effectively, you must first understand the symbols. These elements are standardized across the Unified Modeling Language (UML). Using them correctly ensures your diagram is readable by anyone familiar with the standard.
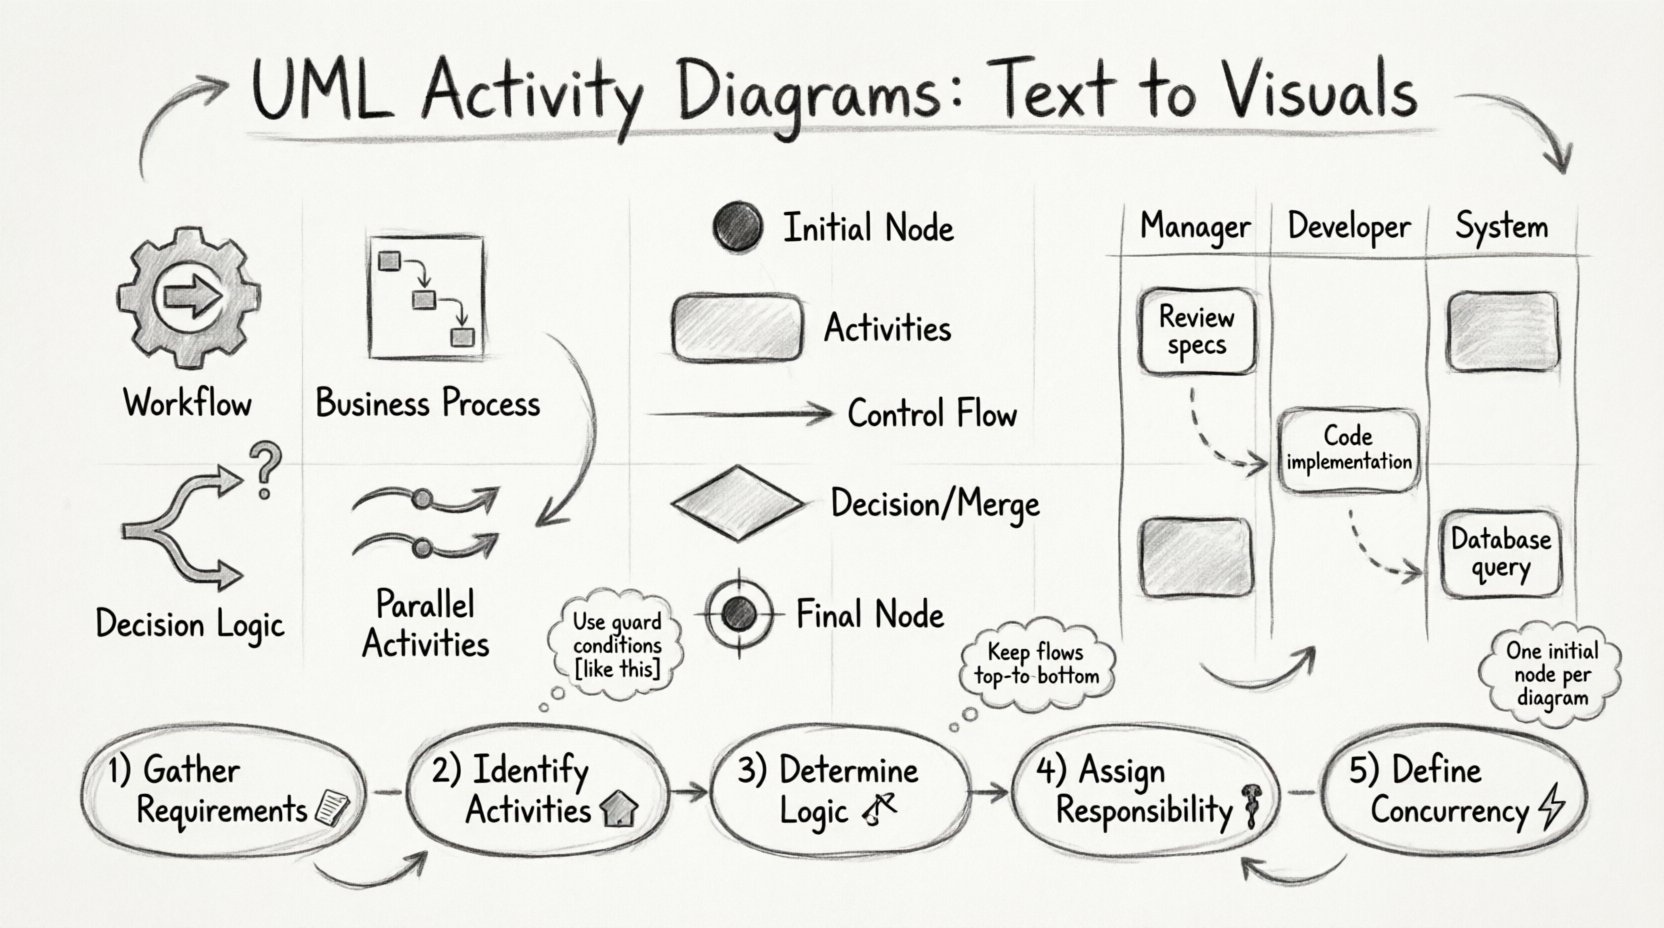
1. Initial Node (Start Point) ⚫
Every activity diagram begins with a single filled black circle. This represents the initial state of the process. There should only be one initial node per diagram. From this point, control flows to the first activity or object.
2. Activity State (Action) ⬜
Activities are represented by rounded rectangles. These denote work being performed. An activity can be a simple task, like Validate User Input, or a complex sub-process. Inside the rectangle, you place the name of the action. If the action is too detailed, you might create a nested diagram or a separate component.
3. Control Flow (Arrows) ➡️
Directed lines connect the nodes. These arrows indicate the sequence of operations. They show the path from one activity to the next. The default direction is top-to-bottom or left-to-right. If the flow moves backward, it creates a loop, indicating iteration.
4. Decision Node (Diamond) ⬦
Decision nodes look like a diamond shape. They represent a point where the flow splits based on a condition. You must have a guard condition on each outgoing edge from a decision node. A guard condition is a boolean expression enclosed in square brackets, such as [isVerified]. Only one branch is taken at a time.
5. Merge Node (Diamond) ⬦
Similar to a decision node, a merge node combines multiple flows into a single flow. It does not make decisions; it simply unites paths. You will often see a decision node followed by a merge node further down the path.
6. Final Node (End Point) ⏺️
The process concludes at a final node, which is a filled circle inside a larger empty circle. This indicates that the activity has completed. A diagram can have multiple final nodes if there are multiple ways to terminate a process successfully or unsuccessfully.
🏊 Swimlanes for Clarity
When a process involves multiple actors, such as different departments or system components, a single flow can become cluttered. Swimlanes solve this problem. They partition the diagram into vertical or horizontal lanes. Each lane is assigned to a specific actor or subsystem.
Placing an activity within a specific lane indicates which actor is responsible for it. This is crucial for understanding hand-offs and responsibilities.
Types of Swimlanes
| Type | Focus | Example Use |
|---|---|---|
| Object Swimlane | Focuses on specific data objects | Tracking the lifecycle of a Customer Object |
| Role Swimlane | Focuses on human roles | Assigning tasks to Manager vs Developer |
| Partition | General grouping for any context | Separating Frontend logic from Backend logic |
Using swimlanes helps prevent the spaghetti diagram effect where arrows crisscross the page randomly. It organizes the complexity logically.
🛠️ The Process: From Text to Visuals
Creating a diagram is not just about drawing shapes. It is a translation process. You start with textual requirements and convert them into visual logic. Follow this structured workflow.
Step 1: Gather Requirements 📝
Collect all relevant text. This could be use cases, user stories, or functional specifications. Identify the triggers. What starts the process? Is it a user login? A scheduled job? This becomes your Initial Node.
Step 2: Identify Activities 🏗️
Break down the process into discrete steps. Look for verbs in the text. Calculate, Send, Update. These are your Activity States. List them out. Do not group too many actions into one box; keep them atomic where possible.
Step 3: Determine Logic and Decisions ⚖️
Review the activities for conditions. Does step B happen only if step A succeeds? Does step C happen if the user is premium? These are your Decision Nodes. Define the guard conditions clearly. Avoid vague terms like check if okay; use specific logic like [balance > 0].
Step 4: Assign Responsibility 🏃
Decide who or what performs each step. If multiple roles are involved, create Swimlanes. Place the Activity State boxes into the appropriate lanes. This visualizes the hand-off points.
Step 5: Define Concurrency (Optional) ⚡
Does the system need to do two things at once? For example, sending an email while logging the event. Use Fork and Join nodes to represent this parallelism.
- Fork Node: A thick horizontal bar that splits one flow into multiple concurrent flows.
- Join Node: A thick horizontal bar that waits for all incoming flows to arrive before continuing.
If you use concurrency, ensure you understand the synchronization requirements. A Join node waits for all branches. If one branch takes longer, the process pauses.
📊 Object Flows vs Control Flows
It is vital to distinguish between control flow and object flow. Confusing these can lead to misunderstandings about data movement.
- Control Flow: Represents the sequence of events. It dictates when something happens. It is the backbone of the diagram.
- Object Flow: Represents the movement of data. It shows what is being passed. It is often drawn as a dashed line with an arrow, pointing to a data store or object.
For simple workflows, control flow is often sufficient. However, in data-heavy processes, object flows add necessary context. For instance, a Validate Order activity might consume an Order Object and produce a Validation Result Object.
🚧 Common Pitfalls and How to Avoid Them
Even experienced modelers make mistakes. Being aware of common errors can save hours of revision.
1. Too Many Paths
Do not try to show every single exception in one diagram. If the diagram becomes too complex, it loses its value. Consider creating a separate diagram for error handling or alternative flows. Keep the primary diagram focused on the happy path.
2. Ambiguous Guard Conditions
Never leave a decision node without a guard condition. If you have two outgoing edges from a diamond, label both. If one is [true], the other should be [false]. This eliminates confusion about which path is taken.
3. Crossing Lines
Try to minimize the number of lines that cross each other. This is often called the planar graph problem. Use Swimlanes to separate different sections. If lines must cross, use an edge label to clarify the connection, though this is a last resort.
4. Incomplete Termination
Ensure every path leads to a Final Node. If a path ends abruptly, it implies an error or an unknown state. Every valid sequence should have a clear end.
5. Mixing Levels of Abstraction
Do not mix high-level business steps with low-level code logic in the same diagram. If you are modeling a business process, do not include if (x == 5) logic unless it is relevant to the business rule. Keep the granularity consistent.
🔍 Advanced Concepts: Guard Conditions and Iteration
As you gain proficiency, you can incorporate more sophisticated logic.
Guard Conditions
A guard condition is a logical expression that must evaluate to true for a transition to occur. It is written in square brackets. For example:
[Inventory > 0]→ Proceed to Ship[Inventory = 0]→ Proceed to Notify Supplier
If the condition is not met, the transition is blocked. This is different from a decision node, which splits the flow. Guard conditions are placed on the edges themselves.
Iteration (Loops)
Loops are essential for processes that repeat. In UML, a loop is created by drawing an arrow from a later activity back to an earlier decision node. You can label the return arrow with [Continue?].
Be careful with infinite loops. While a diagram can represent an infinite loop, in practice, you should ensure there is a break condition. Always document the termination criteria for loops.
📝 Documentation and Maintenance
A diagram is not a static artifact. It is a living document that should evolve with the system. As the software changes, the diagram must change.
- Version Control: Keep track of diagram versions. If the logic changes, update the diagram and note the revision date.
- Annotations: Use notes to explain complex logic that cannot be expressed with standard symbols. A note is a rectangle with a folded corner.
- Review Cycles: Regularly review diagrams with the development team. Ask: Does this match the code? and Is this accurate for the requirements?
Maintaining diagrams is often difficult because it is easy to forget to update them. Treat the diagram as code. It belongs in the repository. If it is not updated during a code change, it is considered technical debt.
🌐 Integration with Other Diagrams
Activity diagrams do not exist in isolation. They complement other UML diagrams.
Use Case Diagrams
Use Case diagrams show what the system does from a user perspective. Activity diagrams show how it does it internally. You can link a Use Case to an Activity Diagram to provide detailed implementation logic.
Sequence Diagrams
Sequence diagrams focus on time and object interaction. Activity diagrams focus on control flow. They are often used together. An Activity Diagram might trigger a Sequence Diagram for a specific complex activity.
State Machine Diagrams
State Machine diagrams describe the lifecycle of a single object. Activity diagrams describe the flow of a process involving multiple objects. Sometimes, an Activity Diagram transition can trigger a State Transition in an object.
🛡️ Best Practices for Readability
Visual clarity is paramount. A diagram that cannot be read is useless.
- Consistent Spacing: Keep equal spacing between nodes. Avoid clusters that look like islands.
- Uniform Shapes: Ensure all activity states use the same rounded rectangle style.
- Clear Labels: Use action verbs for activities. Avoid nouns. Calculate is better than Calculation.
- Direction of Flow: Keep the flow generally top-to-bottom. If you must go sideways, ensure the direction is clear.
- Minimal Text: Keep labels concise. If a description is needed, use the note feature.
🎯 Summary of Workflow
Creating a UML Activity Diagram is a systematic process of abstraction. It requires breaking down text into steps, identifying logic, assigning responsibility, and drawing the connections. By following these guidelines, you can produce diagrams that are not just pictures, but functional documentation.
Remember the core principles:
- Start with a single Initial Node.
- Break down actions into atomic activities.
- Use Decision Nodes for logic branching.
- Use Swimlanes for role separation.
- End with clear Final Nodes.
- Keep it clean and uncluttered.
With practice, drawing these diagrams becomes intuitive. You will find yourself thinking in flows before you write code. This shift in perspective leads to better design and fewer bugs. The visual model becomes a blueprint that guides the entire development lifecycle.