


Visual modeling is a cornerstone of system design and software engineering. When planning a complex process, stakeholders often reach for a diagram to map out logic, data movement, and decision points. However, two primary candidates frequently compete for attention: the Flowchart and the UML Activity Diagram. While they share visual similarities, their underlying semantics, intended audiences, and technical capabilities differ significantly. Choosing the wrong one can lead to ambiguity in requirements, confusion among developers, and maintenance nightmares later in the lifecycle.
This guide provides a deep technical analysis of both notations. We will dissect their symbols, explore their specific strengths, and define clear scenarios where one clearly outperforms the other. Whether you are a business analyst defining a workflow or a software architect designing a backend service, understanding these distinctions is critical.
Understanding the Flowchart 📊
Flowcharts are among the oldest forms of process visualization, originating in the 1940s. Their primary purpose is to represent a sequence of operations or an algorithm. They are general-purpose tools used across industries, from manufacturing to general business administration.
Core Characteristics
- General Purpose: Applicable to any sequential process, not just software.
- Linear Focus: Primarily designed to show a step-by-step path from start to finish.
- Simplicity: Uses a limited set of standard symbols to denote actions, decisions, and terminators.
- Decision Logic: Excellent for showing conditional branching (If/Then/Else).
Standard Symbols
Flowcharts rely on a specific vocabulary of shapes that convey meaning without text:
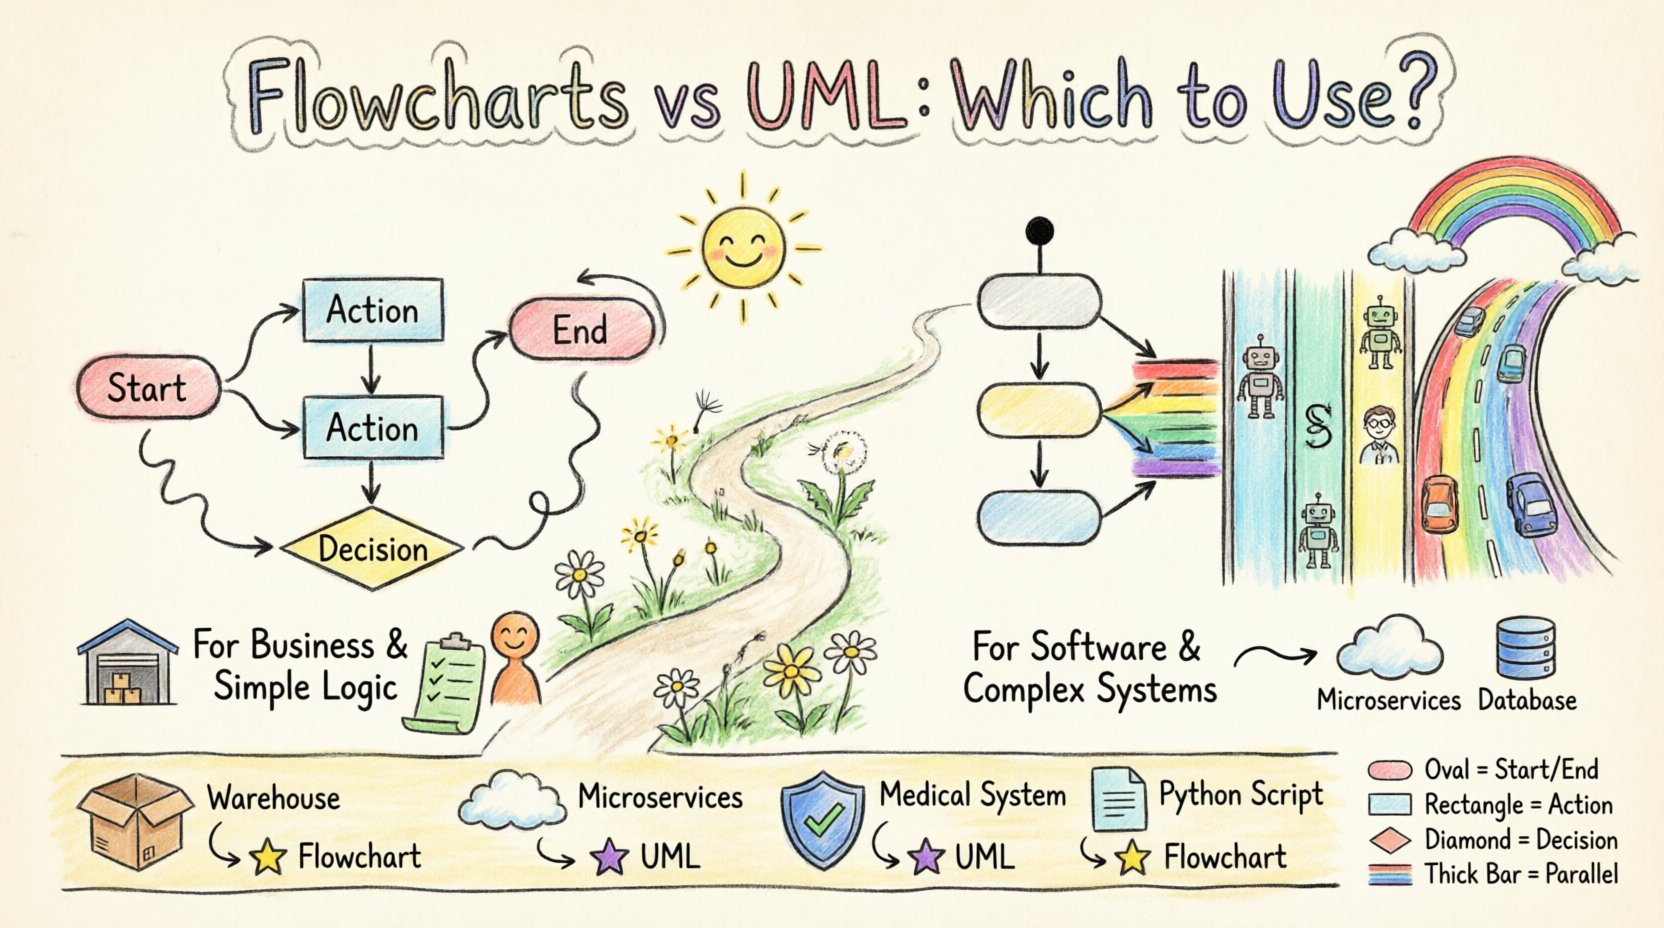
- Oval: Represents the Start or End of the process.
- Rectangle: Indicates a specific process, action, or task.
- Diamond: Denotes a decision point where the path splits based on a condition.
- Parallelogram: Signifies input or output operations.
- Arrow: Shows the direction of the flow.
When Flowcharts Excel
Flowcharts are the go-to choice when the focus is on business logic rather than system architecture. They are ideal for:
- Documenting standard operating procedures (SOPs).
- Mapping out simple data processing steps.
- Explaining logic to non-technical stakeholders.
- Visualizing algorithms for educational purposes.
- Quickly sketching a workflow during a brainstorming session.
However, flowcharts struggle when modeling concurrency. Representing parallel processes often requires complex annotations or messy crossing lines, making the diagram hard to read as complexity increases.
Understanding UML Activity Diagrams 🏗️
The Unified Modeling Language (UML) Activity Diagram is a specialized notation designed specifically for software systems. While it looks similar to a flowchart, it is built on the same theoretical foundation as State Machine diagrams and Sequence diagrams. It is part of the behavioral diagrams in the UML standard.
Core Characteristics
- Software Context: Designed to model the dynamic aspects of a software system.
- Concurrency Support: Native support for parallel execution paths using Fork and Join nodes.
- Object Flow: Can represent the movement of data objects between actions, not just control signals.
- Swimlanes: Explicitly separates activities by responsibility (e.g., different actors or system components).
Key UML Symbols
Activity diagrams use a richer set of symbols to handle complex system behaviors:
- Black Circle: The Initial Node (Start).
- Double Circle: The Final Node (End).
- Rounded Rectangle: Represents an Activity or Action.
- Diamond: The Decision Node (similar to flowchart diamonds but strictly for control flow).
- Thick Bar: Represents a Fork (splitting into parallel paths) or Join (merging parallel paths).
- Object Node: Shows data objects being passed between actions.
- Pin: Specifies input or output parameters for an action.
When UML Activity Diagrams Excel
These diagrams are essential when the complexity of the system requires precision regarding timing and resource allocation. They are ideal for:
- Modeling concurrent processes in distributed systems.
- Defining the logic of a specific use case within a software application.
- Visualizing the interaction between different subsystems.
- Specifying the requirements for automated testing scenarios.
- Documenting complex workflows where data objects change state.
Key Differences at a Glance 📝
While both diagrams map processes, the granularity and intent differ. The following table breaks down the technical distinctions.
| Feature | Flowchart | UML Activity Diagram |
|---|---|---|
| Primary Domain | General Business / Algorithms | Software Systems / Engineering |
| Concurrency | Poor support (requires workarounds) | Native (Fork/Join nodes) |
| Data Flow | Implied or separate | Explicit (Object Flows) |
| Responsibility | Often linear or global | Explicit Swimlanes |
| Integration | Standalone document | Part of UML suite (Sequence, Class) |
| Complexity | Low to Medium | Medium to High |
| Standardization | ANSI / ISO | OMG UML Standard |
Deep Dive: Concurrency and Parallelism ⚡
One of the most significant technical differentiators is how each notation handles parallelism. In modern software, systems rarely execute tasks in a single, straight line. Background processes, network requests, and multi-threaded operations happen simultaneously.
Flowchart Limitations
In a flowchart, representing parallelism is awkward. You might draw two separate paths that seem to run at the same time, but there is no formal mechanism to enforce synchronization. If you have a “Wait for A” and “Wait for B” step, a flowchart struggles to show that the next step only happens when both are complete without creating a confusing web of lines.
UML Activity Diagram Strengths
UML Activity Diagrams were built to solve this. They utilize Fork Nodes and Join Nodes.
- Fork: A thick horizontal bar that splits one control flow into multiple concurrent flows.
- Join: A thick horizontal bar that waits for all incoming flows to arrive before continuing the process.
This allows architects to model multi-threaded applications, background job queues, or asynchronous API calls with mathematical precision. For example, when a user submits a form, the system might send an email (Action A), save the database record (Action B), and log the event (Action C) simultaneously. A UML diagram can show these three branches splitting from a Fork and merging at a Join, ensuring the user only sees a “Success” message after all three are done.
Data Flow vs. Control Flow 🔄
Another critical distinction lies in how data is treated. A flowchart focuses heavily on Control Flow—the order in which actions occur. It asks, “What happens next?”
UML Activity Diagrams, however, can explicitly model Data Flow alongside Control Flow. This is achieved through Object Flows.
Object Nodes
UML diagrams allow you to draw lines representing objects (data) moving between actions. This is vital for understanding state changes within a system.
- Input Pin: An action cannot start without specific input data.
- Output Pin: An action produces data that becomes an input for the next action.
Consider a banking transaction. A flowchart might show “Validate User” -> “Check Balance” -> “Deduct Funds”. An Activity Diagram can show the Account Object flowing into the “Check Balance” action, and the Transaction Object flowing out of “Deduct Funds”. This makes the diagram self-documenting regarding the data structure involved, which helps developers map the logic directly to code classes.
Swimlanes and Responsibility 🏊
As systems grow, knowing who or what is performing an action becomes as important as knowing what is happening. Both notations support swimlanes (horizontal or vertical divisions), but UML handles them with greater structural integrity.
Flowchart Swimlanes
Flowchart swimlanes are often just visual containers. They group actions but do not enforce strict boundaries. Moving an action from one lane to another in a drawing tool is often just a matter of dragging a shape.
UML Swimlanes (Pools)
In UML, swimlanes are often referred to as Partitioned Activity Diagrams. They represent:
- Classes: Which software component performs the action?
- Objects: Which specific instance manages the state?
- Roles: Which business role (e.g., “Admin”, “Customer”) is involved?
This is crucial for defining responsibilities. If an action sits in the “External Service” lane, developers know it requires an API call. If it sits in the “Database” lane, it requires a query. This clarity reduces communication overhead between teams.
Use Case Scenarios: Making the Choice 🛠️
How do you decide which tool to use in a real project? Here are specific scenarios to guide your decision.
Scenario 1: Business Process Optimization
Context: A logistics company wants to streamline its shipping process. They need to show how a package moves from a warehouse to a customer.
Recommendation: Flowchart.
Reasoning: The stakeholders are operations managers, not software engineers. They care about steps (Pick, Pack, Ship, Deliver), not database transactions or API calls. A flowchart is universally understood and requires less training to interpret.
Scenario 2: Microservices Architecture
Context: A team is designing a new payment gateway with multiple microservices (Auth, Billing, Notification).
Recommendation: UML Activity Diagram.
Reasoning: You need to model how services communicate. You need to show that the Notification service runs in parallel with the Billing service (Fork/Join). You need to show that the Payment Object flows from Auth to Billing. A flowchart cannot capture these architectural constraints effectively.
Scenario 3: Regulatory Compliance
Context: A healthcare application must prove that patient data is never accessed without a specific audit log.
Recommendation: UML Activity Diagram.
Reasoning: Compliance requires precise verification of control paths. You must prove that the “Audit Log” action is a mandatory dependency before the “Data Access” action completes. The strict control flow semantics of UML allow for formal verification.
Scenario 4: Simple Scripting Logic
Context: A developer is writing a Python script to rename files in a folder.
Recommendation: Flowchart.
Reasoning: The logic is linear: Loop through files -> Check extension -> Rename -> Log. The overhead of defining UML classes, object flows, and swimlanes is unnecessary. A simple flowchart or even pseudocode is sufficient.
Advanced UML Features for Complex Systems 🧩
If you choose UML Activity Diagrams, you gain access to features that elevate the diagram beyond a simple map. These features allow for modeling behavior that mirrors actual code execution.
Nested Activity Diagrams
Complex systems often have actions that are too detailed to show on the main diagram. UML allows you to encapsulate a sub-process within a single action node.
- Benefits: Keeps the main diagram clean and high-level.
- Usage: Click an action node to open a new, detailed diagram showing the inner logic.
- Analogy: Like a function call in programming. The main diagram calls the function, the sub-diagram shows the code.
Exception Handling
Software rarely runs without errors. UML Activity Diagrams support Exception Handlers. You can define a path that activates only if an action fails (throws an exception).
- Standard Flow: Everything succeeds.
- Exception Flow: Something breaks, and the system routes to a recovery routine.
This is critical for robust system design. A flowchart typically handles errors with a separate “Error” box, but UML explicitly links the exception to the specific action that caused it.
Preconditions and Postconditions
UML allows you to attach constraints to actions. You can specify what must be true before an action starts (Precondition) and what is guaranteed after it finishes (Postcondition).
- Precondition: “User must be logged in”.
- Postcondition: “Order ID is generated”.
This adds a layer of formal specification that is often missing from general process maps.
Common Pitfalls and Best Practices ⚠️
Regardless of which diagram you choose, poor modeling can lead to confusion. Here are common mistakes to avoid.
1. Over-Modeling
Do not create a UML Activity Diagram for a simple login screen. It adds cognitive load. Match the complexity of the diagram to the complexity of the system. If a flowchart suffices, do not force a UML diagram.
2. Ignoring Data Flow
In UML diagrams, do not just show arrows for control. Show the data objects flowing. If an action modifies a record, show the record object flowing out and a modified version flowing in. This prevents developers from guessing which data structures are involved.
3. Mixing Notations
Do not mix UML symbols with Flowchart symbols in the same diagram. For example, do not use a Flowchart Terminator (Oval) inside a UML Activity Diagram (which should use a Black Circle). This creates ambiguity for anyone reading the diagram.
4. Lack of Swimlanes
When using UML for multi-actor systems, always use swimlanes. A diagram without swimlanes forces the reader to constantly ask, “Who is doing this?” Swimlanes answer this question visually.
5. Crossing Lines
Both notations suffer from the “spaghetti diagram” problem. Keep control flow lines clean. If a path loops back, try to route it along the edge of the diagram rather than cutting through the middle of actions.
Integration with Other Diagrams 🔗
UML Activity Diagrams are rarely used in isolation. They are part of a cohesive modeling strategy.
Interaction with Sequence Diagrams
Use a Sequence Diagram to show the timeline of messages between objects. Use an Activity Diagram to show the internal logic of a specific object or use case. They complement each other: one shows when things happen (Sequence), the other shows how the logic works (Activity).
Interaction with Class Diagrams
The Object Flows in an Activity Diagram should map directly to the Classes in a Class Diagram. If your Activity Diagram shows a “Customer” object, you must have a “Customer” class defined. This ensures consistency between the behavioral and structural views of the system.
Final Considerations for Implementation 💡
Choosing between these modeling techniques is not just about aesthetics; it is about communication fidelity. The diagram must convey the necessary information to the intended audience without introducing noise.
For Business Stakeholders
Stick to Flowcharts. They are the lingua franca of business process management. They focus on the “What” and “How” without getting bogged down in technical constraints. If a business analyst needs to approve a workflow, a flowchart reduces the barrier to entry.
For Development Teams
Adopt UML Activity Diagrams. The precision regarding concurrency, exceptions, and data flow saves development time by clarifying edge cases before code is written. It serves as a blueprint that reduces ambiguity during implementation.
For System Architects
You will likely need both. Use Flowcharts for high-level service orchestration and business rules. Use UML Activity Diagrams for the detailed implementation logic of specific components. This hybrid approach ensures that the big picture remains visible while the technical details remain rigorous.
Ultimately, the goal of modeling is clarity. Whether you choose the simplicity of a flowchart or the precision of a UML Activity Diagram, the diagram must serve as a source of truth. Avoid creating diagrams that no one reads. Keep them updated, keep them simple where possible, and ensure they accurately reflect the system you are building.