Understanding the flow of time within a system is critical for engineers designing real-time applications, embedded devices, or complex communication protocols. The Unified Modeling Language (UML) provides several tools for visualization, but few capture the temporal aspect as precisely as the Timing Diagram. This artifact focuses on the state of objects over a specific timeline, offering a granular view of interactions that other diagrams might obscure.
When designing systems where milliseconds matter, a Timing Diagram becomes an essential blueprint. It maps out the precise moments when signals are sent, received, or processed. This guide explores the structure, syntax, and application of this modeling technique, ensuring clarity in system design without relying on specific software tools.
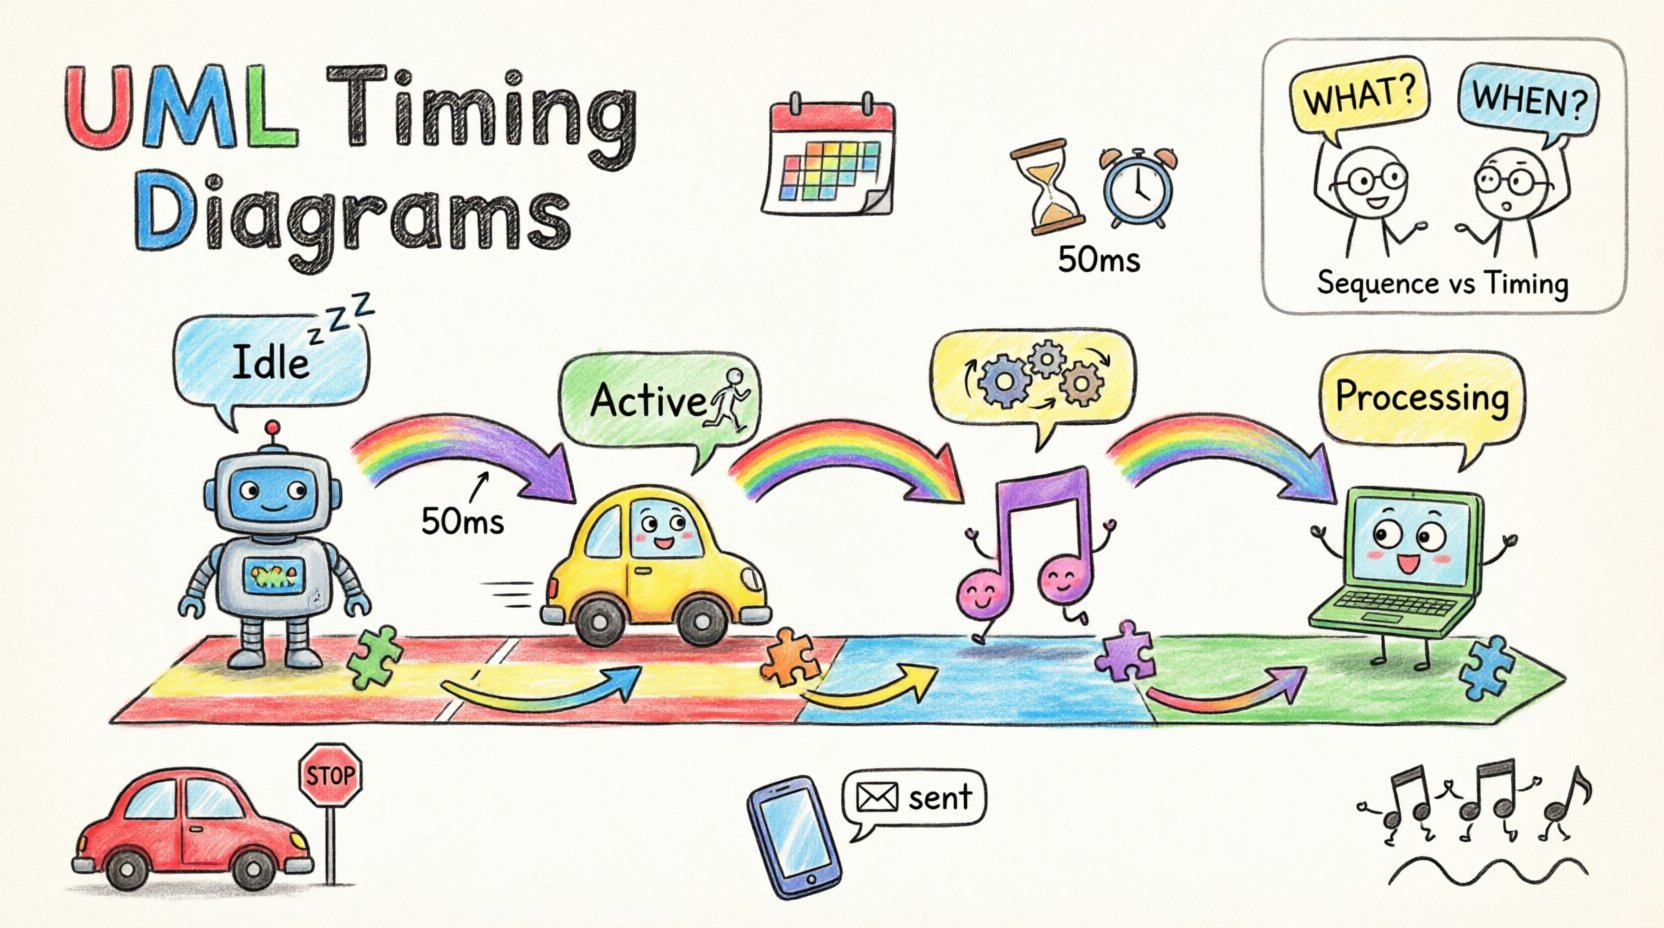
What is a UML Timing Diagram? ⏱️
A UML Timing Diagram is a behavioral diagram used to model the interactions of objects over time. Unlike a Sequence Diagram, which emphasizes the order of messages, a Timing Diagram emphasizes the exact state changes of objects and the timing constraints associated with them. The horizontal axis represents time progressing from left to right, while the vertical axis lists the objects or classifiers involved in the interaction.
This diagram type is particularly useful for:
- Real-time Systems: Where strict deadlines must be met.
- Embedded Control: Showing how hardware components react to software triggers.
- Concurrency: Visualizing parallel processes and their synchronization points.
- Resource Usage: Tracking how long a resource is occupied.
Core Components and Syntax 🛠️
To create an accurate model, one must understand the fundamental building blocks. The visual language is relatively simple but carries specific semantic weight.
1. Lifelines 📏
Lifelines represent the participating objects or instances. They appear as vertical columns extending downwards. Each lifeline has a header containing the object name and type. The top of the lifeline marks the beginning of the observation period.
2. State Boxes (State Lenses) 🟦
State boxes indicate the state of an object at a specific point in time. They are rectangular blocks placed on the lifeline. The color or label inside the box describes the current state (e.g., Active, Idle, Processing). Changes in state are shown as transitions between these boxes.
3. The Time Axis ⏰
Time flows horizontally. Major ticks often represent specific units (seconds, milliseconds, cycles). It is crucial to label this axis clearly so that the duration of events is unambiguous.
4. Timing Constraints ⏳
Constraints define the allowable time intervals for events. They are often displayed as brackets or annotations above the relevant section of the lifeline. For example, a constraint might specify that a response must occur within 50 milliseconds of a request.
Reading and Interpreting the Diagram 👁️
Reading a Timing Diagram requires a left-to-right scan. You follow the horizontal timeline to see how the vertical lifelines change state relative to each other.
Key Reading Patterns
- Duration: Look at the width of the state boxes. A wide box indicates a long duration of activity.
- Overlap: Where boxes from different lifelines overlap horizontally, it indicates concurrent execution.
- Transitions: The boundaries between state boxes represent the moment an event triggers a state change.
- Gaps: Empty space on a lifeline indicates an inactive or waiting state.
Timing Diagram vs. Sequence Diagram ⚔️
Confusion often arises between Timing Diagrams and Sequence Diagrams. While both model interactions, their focus differs significantly.
| Feature | Timing Diagram | Sequence Diagram |
|---|---|---|
| Primary Focus | Time and State Duration | Order of Messages |
| Time Axis | Explicit Horizontal Axis | Implicit (Left to Right) |
| State Visibility | Shows State Changes Explicitly | Shows Message Flow Only |
| Concurrency | Visualized via Overlap | Visualized via Parallel Frames |
| Best Used For | Real-time constraints, Latency | Logic flow, API interactions |
Use a Sequence Diagram to understand what happens. Use a Timing Diagram to understand when it happens and for how long.
Step-by-Step Modeling Process 📝
Constructing a valid Timing Diagram involves a structured approach. It begins with understanding the system requirements and ends with verification.
Step 1: Identify Objects 🧩
List all the entities that participate in the interaction. These could be software modules, hardware sensors, or user interfaces. Create a lifeline for each.
Step 2: Define States 🎯
Determine the possible states for each object. For a sensor, states might be Off, Calibrating, Reading, and Error. Define these clearly before drawing.
Step 3: Establish Timeline ⏱️
Set the time scale. Is the system running in real-time (seconds) or event-driven (cycles)? Mark the start and end points of the scenario.
Step 4: Map Events and Transitions 🔄
Draw the state boxes. Indicate when an event triggers a transition from one state to another. Ensure the horizontal placement reflects the actual timing.
Step 5: Add Constraints 🔒
Annotate critical time windows. If a system must respond within a specific window, mark this constraint on the diagram to highlight potential risks.
Advanced Concepts: Nested States and Expressions 🧠
Complex systems often require more detailed modeling than simple state boxes allow.
Nested States
A state box can contain sub-states. This is useful for showing internal behavior while the object is in a high-level state. For instance, an object in a Running state might have nested states for Idle, Processing, and Waiting.
Timing Expressions
Constraints can be mathematical or descriptive. Common expressions include:
- Duration: [duration: 10ms]
- Delay: [delay: > 500ms]
- Window: [window: 100ms-200ms]
These expressions provide precision for automated verification tools or human reviewers checking compliance with specifications.
Common Pitfalls and How to Avoid Them ⚠️
Even experienced modelers can introduce errors that obscure the diagram’s value. Awareness of common mistakes improves the quality of the output.
1. Overcrowding the Lifelines
Adding too many objects to a single diagram creates visual noise. If a scenario involves ten different components, consider splitting the diagram into multiple views or using a high-level overview with detailed sub-diagrams.
2. Ignoring Time Granularity
Using inconsistent time units confuses readers. Do not mix seconds and milliseconds without clear labels. Always define the unit of measurement on the time axis.
3. Ambiguous State Transitions
Ensure every state transition is triggered by a clear event. If a state changes without an explicit trigger, the diagram becomes speculative rather than descriptive.
4. Lack of Context
A Timing Diagram should not exist in a vacuum. Reference the relevant Use Cases or Class Diagrams to ensure the objects and states align with the broader system architecture.
Best Practices for Clarity 🌟
To ensure the diagram serves its purpose effectively, adhere to these guidelines.
- Consistent Naming: Use the same naming conventions for objects and states across all diagrams.
- Color Coding: Use colors to distinguish between different types of events (e.g., Input, Output, Internal), but ensure the diagram remains readable in black and white.
- Alignment: Align state transitions vertically where they occur simultaneously. This visually reinforces the concept of synchronization.
- Annotations: Add notes for complex logic that cannot be easily represented by shapes alone.
- Validation: Review the diagram against the actual system requirements. Does the timing match the physical or logical constraints?
Real-World Use Cases 🚀
Understanding where to apply this tool is as important as knowing how to draw it. Below are scenarios where Timing Diagrams provide unique value.
Embedded Control Systems
In automotive or aerospace systems, safety depends on precise timing. A braking system must activate within a specific window after a sensor detects an obstacle. A Timing Diagram can verify that the signal path from sensor to actuator meets this deadline.
Network Protocols
Protocols often have strict handshaking sequences. A Timing Diagram can show the latency between a request and an acknowledgment. This is vital for diagnosing network bottlenecks or timeout issues.
Audio and Video Processing
Multimedia applications require synchronization. If audio and video streams are not aligned, the user experience degrades. Modeling the buffering and rendering states helps engineers balance the pipeline.
Database Transactions
Locking mechanisms and commit operations have time constraints. Visualizing how long a transaction holds a lock helps identify potential deadlocks or performance degradation under load.
Verification and Testing Alignment ✅
The diagram is not just a static document; it is a basis for verification. Test cases can be derived directly from the state transitions and timing constraints.
- Timing Tests: Verify that the system meets the duration constraints specified in the diagram.
- State Tests: Ensure that the system enters the correct states when specific events occur.
- Concurrency Tests: Check that parallel processes do not interfere with each other during overlapping time windows.
By aligning test coverage with the diagram, teams ensure that temporal requirements are not overlooked during the development phase.
Integrating with Other Models 🔗
A Timing Diagram rarely stands alone. It integrates with other UML artifacts to provide a complete picture of the system.
- State Machine Diagrams: The states in a Timing Diagram often correspond to states in a State Machine. The Timing Diagram adds the temporal dimension to the logical flow.
- Activity Diagrams: While Activity Diagrams show control flow, Timing Diagrams show when that flow occurs. They complement each other for process-heavy systems.
- Deployment Diagrams: When modeling distributed systems, a Timing Diagram can show network latency between different nodes depicted in a Deployment Diagram.
Final Thoughts on Temporal Modeling 💡
Designing systems that must operate within strict time constraints requires precision. The UML Timing Diagram provides the necessary framework to visualize, analyze, and communicate these constraints. It moves beyond simple logic flow to address the critical dimension of time.
By focusing on lifelines, state changes, and explicit time axes, engineers can identify potential bottlenecks and verify deadlines before implementation begins. While the complexity can be high, the clarity gained in understanding system behavior over time is invaluable. Properly constructed, these diagrams serve as a reliable reference for development, testing, and maintenance throughout the system lifecycle.
Remember that the goal is clarity. If a diagram becomes too complex to read, it fails its purpose. Simplify where possible, annotate where necessary, and always keep the timeline accurate. This disciplined approach ensures that temporal requirements are met and the system performs reliably in its intended environment.