Designing complex systems requires more than just knowing what objects exist; it requires understanding when they act and how long they take to respond. While many developers are familiar with sequence diagrams for capturing interaction order, few delve into the precise temporal dynamics that govern real-time performance. This is where the UML timing diagram becomes an essential tool. It bridges the gap between static structure and dynamic behavior, offering a granular view of time-based interactions.
Whether you are analyzing a control loop, debugging a race condition, or documenting latency requirements, visualizing time is critical. This guide will walk you through the fundamental concepts, structural elements, and practical steps to build a clear, effective timing diagram without relying on specific tooling. We focus on the underlying logic and notation that make these diagrams universally understood.
Understanding the Basics of Time-Based Modeling 🧠
A UML timing diagram is a specialized type of interaction diagram that focuses on the time constraints of state changes. Unlike other diagrams that prioritize the order of messages, this type prioritizes the duration and specific timing of events. It is particularly useful in embedded systems, telecommunications, and any architecture where timing is a functional requirement rather than just a performance metric.
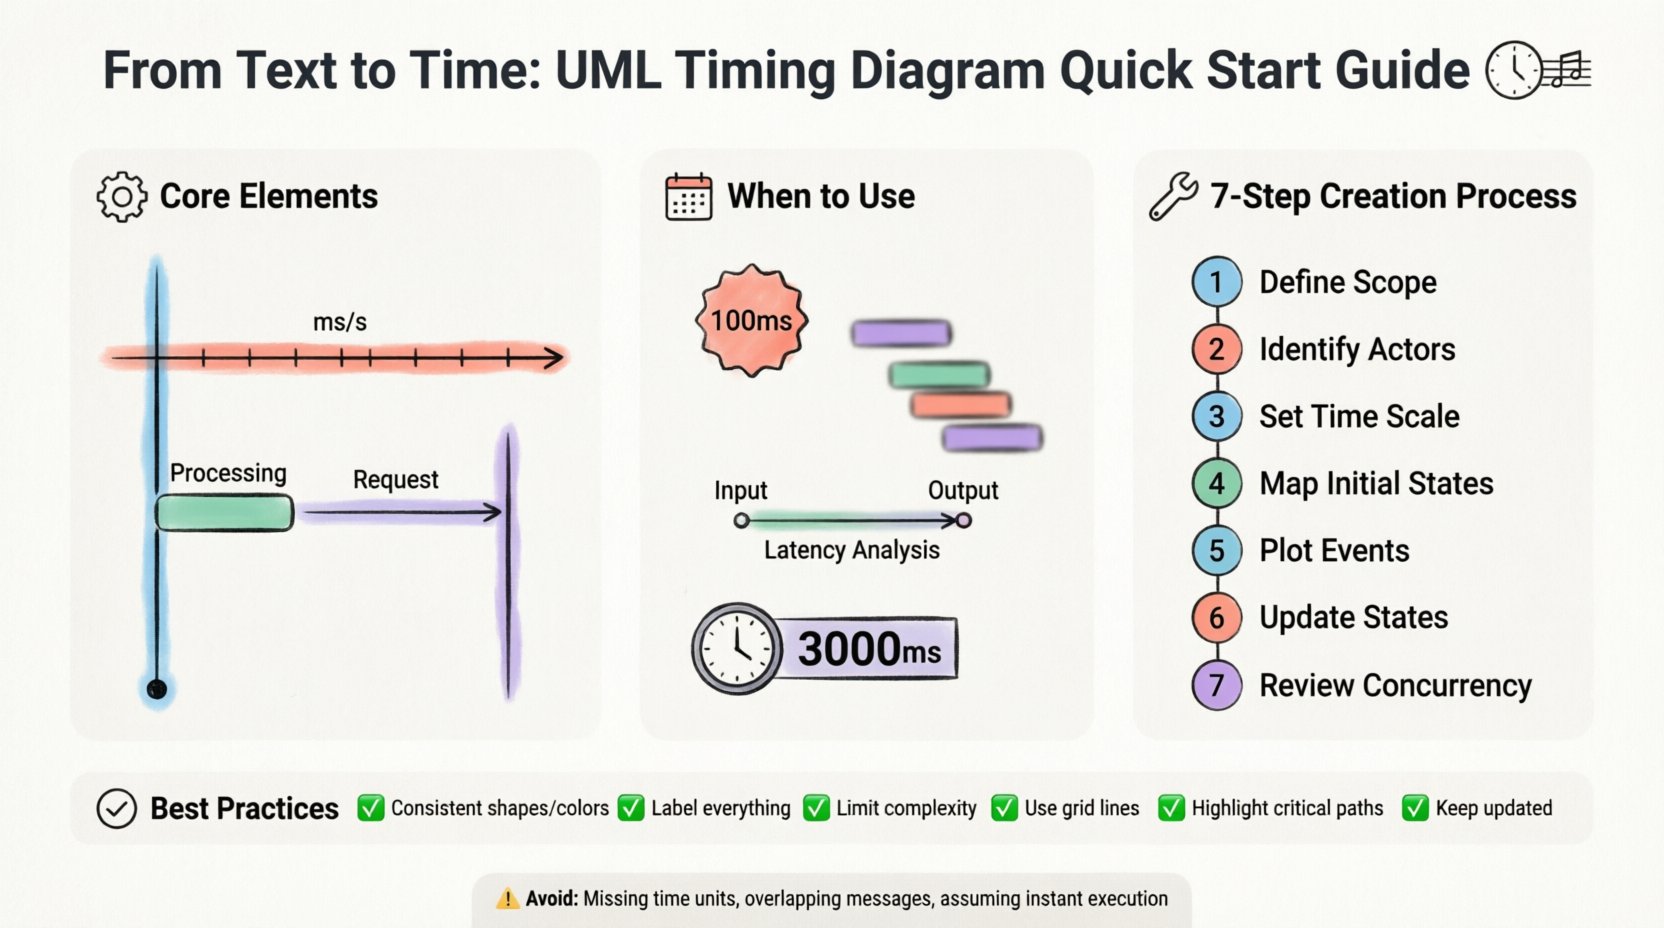
At its core, a timing diagram maps the state of an object or system over a timeline. It allows you to see:
When a specific state begins and ends.
How long a process takes to complete.
Whether multiple processes are running concurrently.
The exact moment an input triggers an output.
Think of it as a musical score for software. While a sequence diagram tells you which instrument plays which note, the timing diagram shows the rhythm, tempo, and duration of each sound. This distinction is vital for systems where a delay of a few milliseconds can cause a failure.
Core Elements of a Timing Diagram ⚙️
To construct a meaningful diagram, you must understand the standard notation. These elements form the vocabulary of time-based modeling. Mastering these components ensures your documentation is clear to other engineers and stakeholders.
1. Lifelines
Lifelines represent the entities participating in the interaction. In a timing diagram, these are typically vertical lines, similar to sequence diagrams. Each lifeline corresponds to a class, object, or subsystem. The vertical axis represents the entity itself, while the horizontal axis represents the passage of time.
2. The Time Axis
The horizontal axis is the defining feature of this diagram type. It flows from left to right, indicating chronological progression. Unlike sequence diagrams where the X-axis is abstract, in timing diagrams, the X-axis often has a defined scale (e.g., milliseconds, seconds, clock cycles). This scale is crucial for verifying if a system meets its real-time constraints.
3. State Bars and Regions
State bars are horizontal rectangles placed on the lifeline. They indicate the state of the object during a specific time interval. For example, a bar might represent an object being in a “Processing” state. The length of the bar directly correlates to the duration of that state. These bars can be stacked or overlapping to show concurrent activities.
4. Messages and Events
Messages are the triggers that cause state changes. In a timing diagram, these are usually represented by arrows crossing lifelines. They mark specific points in time where an interaction occurs. An event can be an incoming signal, an internal computation, or an external interrupt.
5. State Transitions
Transitions occur when an object moves from one state to another. These are often visualized by the end of one state bar and the beginning of another. Sharp vertical lines at the transition point indicate an instantaneous change, while diagonal lines might suggest a gradual transition or a period of uncertainty.
Element | Visual Representation | Purpose |
|---|---|---|
Lifeline | Vertical Line | Identifies the object or system being modeled. |
State Bar | Horizontal Rectangle | Shows the duration of a specific state. |
Message Arrow | Horizontal Arrow with Label | Indicates the transmission of data or signals. |
Time Scale | Horizontal Axis with Markers | Defines the unit of measurement for time. |
Focus of Control | Narrow Rectangle on Lifeline | Indicates active execution or processing time. |
When to Use a Timing Diagram 🗓️
Not every interaction requires a timing diagram. Using the wrong tool can clutter your documentation and confuse the audience. You should consider this notation when:
Real-Time Constraints Exist: If a system must respond within a specific deadline (e.g., 100ms), a timing diagram is the best way to visualize compliance.
Concurrency is Complex: When multiple threads or processes interact simultaneously, visualizing their overlap helps prevent race conditions.
Latency Analysis is Needed: If you need to calculate the total time from input to output, this diagram provides the necessary granularity.
State Duration Matters: If the duration of a state is as important as the state itself (e.g., a timeout period), standard sequence diagrams fall short.
Conversely, if you are only interested in the order of messages without regard for time, a sequence diagram is more appropriate. Timing diagrams add complexity; use them only when temporal precision is a requirement.
Step-by-Step Creation Process 🛠️
Creating a timing diagram is a systematic process. It requires preparation, drafting, and validation. Follow these steps to ensure accuracy and clarity.
Step 1: Define the Scope
Before drawing anything, identify the specific interaction you are modeling. Is this a single transaction? A startup sequence? A loop? Define the start and end points. A diagram that tries to cover the entire system lifecycle will become unreadable. Focus on a critical path.
Step 2: Identify the Actors and Objects
List all the entities involved in the interaction. Assign each a unique name for their lifeline. Keep the names concise. Avoid long labels that will force the diagram to expand horizontally. If an object is complex, consider breaking the diagram into sub-diagrams.
Step 3: Establish the Timeline Scale
Determine the unit of time. Will you measure in seconds, milliseconds, or clock cycles? Mark the axis clearly. If the time scale is non-linear (e.g., zooming in on a specific event), indicate this visually. Consistency in the scale is key to accurate interpretation.
Step 4: Map the Initial States
Place the initial state bars for each object at the start of the timeline. This shows the system configuration before any interaction begins. If an object is idle, represent this with a distinct state bar (e.g., “Idle” or “Wait”).
Step 5: Plot the Events and Messages
Draw the arrows representing messages. Place them at the exact time they occur. If a message takes time to travel, represent the duration. If it is instantaneous, place it at a single point. Ensure the arrows connect the correct lifelines.
Step 6: Update State Bars
As events occur, update the state bars. When an object enters a new state, end the previous bar and start the new one. If an object performs an action, extend the “Focus of Control” rectangle over that period. This visually distinguishes between waiting time and active processing time.
Step 7: Review for Concurrency
Check for overlapping bars. Do any lifelines show simultaneous activity? Ensure that the logic supports this. If two objects are processing at the same time, the diagram should reflect that overlap clearly. This is often where design flaws are discovered.
Best Practices for Clarity 🎯
A diagram is useless if it cannot be read. Clarity is the primary goal of any technical documentation. Adhere to these guidelines to maintain high standards.
Maintain Consistency: Use the same shapes and colors for the same types of states across different diagrams. Consistency reduces cognitive load.
Label Everything: Never leave a state bar or message arrow unlabeled. Include the state name and the duration if known.
Limit Complexity: If a diagram exceeds one page, split it. Do not compress complex logic into a single view. It is better to have a series of focused diagrams than one overwhelming chart.
Use Grid Lines: If drawing by hand or in a tool, use vertical grid lines to align time markers. This makes it easier to read durations.
Highlight Critical Paths: Use bold lines or distinct colors for critical timing paths. This helps reviewers quickly identify the most important constraints.
Keep it Up-to-Date: Timing diagrams can become obsolete quickly if the system logic changes. Ensure they are part of your version control process.
Common Mistakes to Avoid ⚠️
Even experienced modelers make errors when dealing with time. Being aware of common pitfalls can save you significant revision time.
Ignoring Time Units: Failing to specify whether time is in milliseconds or seconds can lead to catastrophic misunderstandings. Always label the axis.
Overlapping Messages: Drawing messages so closely that they appear simultaneous when they are sequential can confuse the reader. Use slight offsets if necessary.
Assuming Instantaneous Execution: Unless an operation is truly atomic, it takes time. Representing long processes as single lines ignores the processing duration.
Neglecting Delays: Networks and queues introduce delays. If a message is sent but not received immediately, show the gap in the timeline.
Mixing Time and Sequence: Do not try to force a sequence diagram’s logic into a timing diagram. If order is the only concern, stick to sequence notation.
Integrating into Documentation 📚
A timing diagram should not exist in isolation. It needs context to be fully useful. Integrate it into your broader system documentation.
Link to Requirements: Connect timing constraints to specific requirement IDs. This provides traceability.
Reference in Test Plans: Use the diagram to define test cases. If the diagram shows a 50ms response time, the test plan should verify that.
Include in Architecture Guides: Place the diagram in the section describing real-time interfaces. It helps developers understand the temporal expectations of the system.
Version Control: Treat the diagram as code. Store it in your repository and commit changes when the timing logic changes.
Advanced Considerations for Complex Systems 🔍
As systems grow, timing diagrams must evolve. For highly complex architectures, consider these advanced techniques.
Grouping and Sub-Systems
When dealing with multiple subsystems, group their lifelines together. Use brackets or shaded regions to indicate which objects belong to the same module. This helps visualize inter-module timing without losing context.
Exception Handling
Standard diagrams often show happy paths. Include branches for error handling. Show what happens to the timeline if a timeout occurs or a message is rejected. This ensures the timing model covers failure scenarios.
Asynchronous Behavior
Not all messages are synchronous. Some are fire-and-forget. Represent asynchronous messages differently than synchronous calls. This distinction clarifies whether the caller waits for a response or continues immediately.
Final Considerations on Time and Precision 🕒
Creating a UML timing diagram is an exercise in precision. It demands that you think about your system not just as a set of connected parts, but as a flow of events occurring in a specific duration. The effort invested in drawing these diagrams pays off during debugging and validation phases.
By following the structural elements and best practices outlined here, you can produce documentation that stands up to technical scrutiny. You move beyond abstract models to concrete representations of system behavior. This clarity reduces risk and improves communication between design and implementation teams.
Remember that a diagram is a living artifact. It should reflect the system as it is, not just as you wish it to be. Regular reviews and updates ensure that the time-based logic remains accurate throughout the project lifecycle. With practice, you will find that visualizing time becomes a natural part of your design process, leading to more robust and reliable software systems.