Time is often the invisible variable in complex system architectures. While functionality dictates what a system does, timing dependencies determine when and how quickly it reacts. For cross-functional teams comprising developers, quality assurance engineers, product managers, and operations specialists, ambiguity in temporal behavior is a primary source of regression, latency issues, and production incidents. A UML Timing Diagram offers a rigorous method to visualize state changes and object interactions over a specific timeline. This guide outlines the essential standards for documenting these dependencies effectively without relying on specific tooling, ensuring clarity and precision across all stakeholders.
🧩 Understanding the Timing Diagram Context
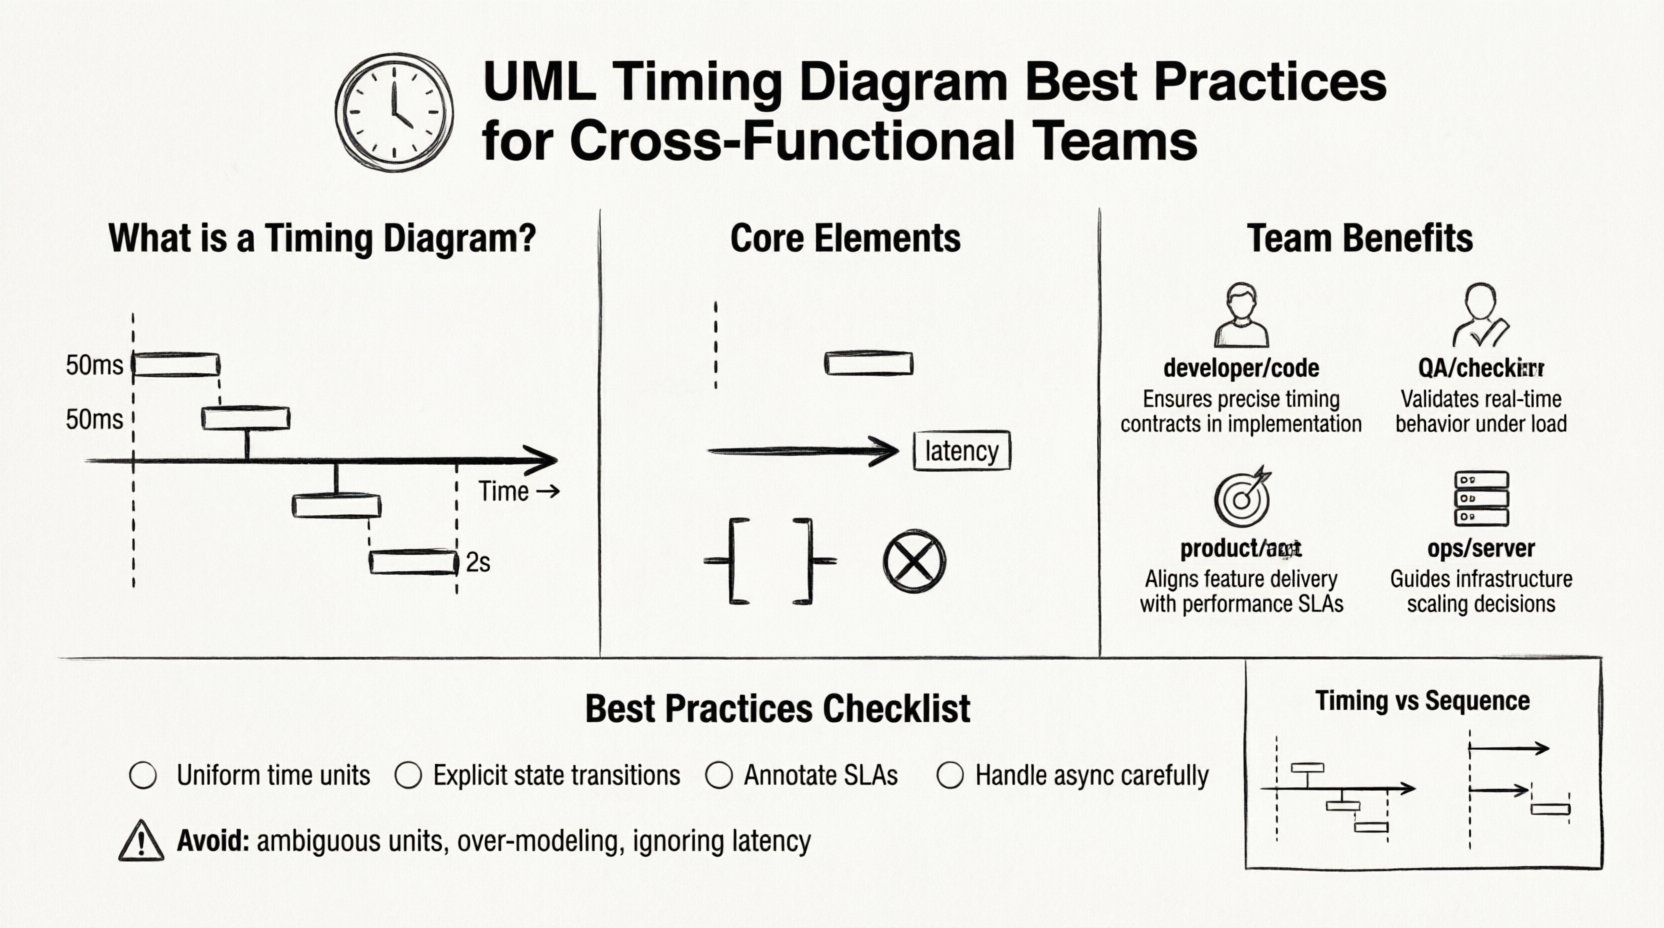
A Timing Diagram is a specific type of Interaction Diagram within the Unified Modeling Language (UML) family. Unlike Sequence Diagrams, which focus primarily on the order of messages exchanged between objects, Timing Diagrams emphasize the precise timing of state transitions and the duration of activities. In systems where milliseconds matter—such as financial transaction processing, real-time sensor data ingestion, or safety-critical control loops—understanding the temporal constraints is non-negotiable.
When modeling these diagrams, the focus shifts from logical flow to temporal accuracy. The horizontal axis represents time, while the vertical axis represents different objects or lifelines. This visual distinction allows teams to spot race conditions, latency bottlenecks, and state overlaps that standard flowcharts often obscure.
🤝 Why Cross-Functional Teams Need Temporal Precision
Development teams often view timing as a backend concern, while operations view it as infrastructure. Product managers focus on user experience expectations. When these perspectives are not aligned through a shared model, friction occurs. A unified Timing Diagram serves as the single source of truth regarding temporal expectations.
- Developers: Require clear definitions of timeout thresholds, blocking states, and asynchronous processing windows to write robust code.
- Quality Assurance: Use timing data to create performance test cases, specifically targeting edge cases where delays trigger failures.
- Product Managers: Define Service Level Agreements (SLAs) and user-perceived latency requirements based on modeled behavior.
- Operations: Monitor system health against modeled baselines, identifying when actual performance deviates from the design specification.
Without a standardized approach to documenting these dependencies, teams risk assumptions. One developer might assume a response arrives within 100ms, while the network architecture assumes 500ms. The Timing Diagram bridges this gap by making the assumption explicit and measurable.
🛠 Core Elements of Effective Timing Documentation
To ensure the diagram is readable and actionable, specific elements must be defined with precision. Avoiding clutter while maintaining accuracy is the primary challenge.
1. Lifelines and Granularity
Lifelines represent the participants in the interaction. In a Timing Diagram, these should correspond to distinct functional components rather than individual lines of code. Grouping related processes under a single lifeline reduces visual noise.
- Define Scope: Ensure each lifeline represents a distinct service, module, or hardware component.
- Consistent Naming: Use domain-driven names (e.g.,
PaymentService) rather than technical implementation names (e.g.,PaymentController_v2) to ensure longevity. - Grouping: Use swimlanes or grouping boxes for related sub-systems to manage complexity.
2. Time Bars and State Occupations
The visual representation of activity is critical. Time bars (or focus of control) indicate when an object is actively processing a request. State occupation bars show when an object is in a specific state.
- Active Processing: Use continuous bars to denote active computation or waiting periods.
- State Changes: Mark transitions clearly with vertical lines indicating the exact moment a state shifts.
- Duration Labels: Annotate bars with specific time values (e.g., “50ms”, “2s”) rather than relative descriptions like “short duration”.
3. Message Timing and Latency
Messages sent between lifelines are not instantaneous in reality. Timing diagrams allow you to model the delay between sending and receiving.
- Explicit Latency: Indicate network or processing delays between the end of one bar and the start of another.
- Asynchronous Signals: Distinguish clearly between synchronous calls (blocking) and asynchronous signals (fire-and-forget).
- Timeouts: Mark the point where a waiting process should be aborted if a response is not received.
📋 Standardizing Timing Dependencies: Best Practices
Documentation quality depends on consistency. The following practices help maintain a high standard of temporal modeling across the organization.
1. Establish a Time Base
Before drawing any lines, agree on the time unit for the diagram. Mixing milliseconds and seconds in the same view creates cognitive load and increases the risk of calculation errors.
- Uniform Units: Choose a base unit (e.g., milliseconds) for the entire diagram or clearly denote units for every label.
- Scale Consistency: Ensure the visual distance on the horizontal axis correlates linearly with the time value.
2. Model State Transitions Explicitly
Many timing issues arise from objects being in the wrong state at the wrong time. Documenting state transitions helps prevent logic errors.
- State Boundaries: Clearly draw the transition points where an object moves from Idle to Processing to Completed.
- Invalid States: Visualize what happens when an invalid state is encountered during a timing window.
- Recovery Windows: Show the time allocated for error recovery before the system times out.
3. Handle Concurrency and Parallelism
Complex systems rarely execute in a strictly linear fashion. Parallel execution paths must be represented to avoid race condition bugs.
- Parallel Frames: Use parallel frames to indicate that multiple lifelines are active simultaneously.
- Resource Locking: Indicate if parallel processes compete for the same resource, creating a potential bottleneck.
- Synchronization Points: Mark the exact moment where parallel flows must converge before proceeding.
4. Annotate Non-Functional Requirements
Timing diagrams are an ideal place to embed constraints that are often treated as separate documents.
- SLA Compliance: Add notes indicating which parts of the flow are critical for meeting SLA targets.
- Latency Budgets: Define the maximum allowable latency for each segment of the interaction.
- Priority Levels: Mark high-priority interactions that should not be delayed by background processes.
5. Manage Asynchronous Interactions Carefully
Asynchronous messages are common in modern architectures but can obscure dependencies if not documented correctly.
- Callback Timing: If a callback is expected, model the time window in which it must arrive.
- Queueing: If messages enter a queue, model the queue depth and processing time.
- Event-Driven Flows: Ensure event triggers are linked to the specific time windows in which they are valid.
📊 Comparison: Timing Diagram vs. Sequence Diagram
To ensure the correct tool is used for the task, teams must understand the distinction between these two modeling artifacts. Confusion often leads to documentation bloat.
| Feature | Timing Diagram | Sequence Diagram |
|---|---|---|
| Primary Focus | State changes and time duration | Order of message exchange |
| Time Representation | Horizontal axis (Explicit scale) | Vertical flow (Relative order) |
| State Visualization | State occupation bars | Focus of control bars only |
| Best Use Case | Performance, timeouts, latency | Logic flow, error handling |
| Complexity | High (Requires precise timing) | Medium (Focus on structure) |
🔄 Collaboration and Review Workflow
Creating the diagram is only half the battle. Ensuring it remains accurate requires a structured review process involving all functional areas.
1. Stakeholder Review
Before finalizing, the diagram must be reviewed by representatives from each team involved in the system.
- Dev Review: Verify technical feasibility of the stated time limits.
- QA Review: Confirm that testable timing thresholds are defined.
- Ops Review: Validate that monitoring can detect deviations from the model.
2. Version Control and Change Management
Timing requirements often change as infrastructure evolves. The documentation must be versioned to track these shifts.
- Change Logs: Record every modification to timing constraints and the reason behind it.
- Impact Analysis: When a time limit changes, identify all downstream dependencies affected.
- Archive Old Versions: Keep historical diagrams for auditing and troubleshooting past incidents.
3. Integration with Requirements
Timing constraints should trace back to specific requirements to ensure nothing is undocumented.
- Traceability Matrix: Link each timing constraint in the diagram to a specific requirement ID.
- Gap Analysis: Check for requirements that lack corresponding visual representation in the diagram.
- Validation: Use the diagram to validate that all time-based requirements are met in the design.
🚧 Common Pitfalls to Avoid
Even experienced modelers fall into traps that reduce the value of the Timing Diagram. Awareness of these common errors helps maintain quality.
- Over-Modeling: Do not include every single millisecond of background processing. Focus on the critical path and decision points.
- Ambiguous Time Units: Never mix seconds and milliseconds without clear labels. This is the most common source of calculation errors.
- Ignoring Network Latency: Assume zero latency for internal calls. In distributed systems, network delay is rarely zero.
- Static Timing in Dynamic Systems: Avoid hardcoding fixed times if the system uses adaptive algorithms. Model ranges instead of fixed values.
- Lack of Error Paths: A timing diagram that only shows success scenarios is incomplete. Model timeout paths and retry loops.
🛡 Maintenance and Evolution
A Timing Diagram is a living artifact. As the system evolves, the diagram must evolve with it to remain a useful communication tool.
1. Regular Audits
Schedule periodic reviews of the diagrams to ensure they match the current system behavior.
- Quarterly Checks: Verify that time constraints have not drifted due to hardware changes or code optimizations.
- Incident Review: After any production incident related to performance, update the diagram to reflect the root cause.
2. Training and Knowledge Sharing
Ensure all team members understand how to read and interpret the diagrams correctly.
- Onboarding: Include diagram reading in the onboarding process for new engineers.
- Workshops: Hold sessions where teams walk through complex timing scenarios together.
- Glossary: Maintain a shared glossary for timing terms to ensure consistent understanding.
🔍 Validation and Verification
The ultimate goal of the documentation is to facilitate verification. The diagram should serve as the basis for testing strategies.
- Test Case Generation: Derive specific test cases based on the time bars and transitions shown.
- Performance Baselines: Use the diagram to establish the baseline performance metrics for monitoring.
- Contract Testing: Treat the timing diagram as a contract between services. If a service violates the timing, it violates the contract.
By adhering to these structured practices, teams can create a robust documentation ecosystem. The effort invested in precise timing documentation pays dividends in reduced debugging time, clearer communication, and more reliable systems. The visual language of the Timing Diagram, when applied with discipline, transforms abstract time constraints into actionable engineering requirements.
Remember that the value lies in the clarity of communication, not the complexity of the drawing. Keep it readable, keep it accurate, and keep it updated. This approach ensures that time remains a manageable dimension in your system architecture rather than a source of unpredictability.