


In the complex world of software engineering and systems analysis, the ability to visualize how information moves through a system is an indispensable asset. Traditionally, creating a Data Flow Diagram (DFD) required hours of manual labor, meticulous shape placement, and constant adjustments to ensure logical consistency. However, with the emergence of the best AI DFD generator features in Visual Paradigm Desktop, this process has been fundamentally transformed. This professional tool allows users to convert plain English descriptions into sophisticated, logically structured diagrams, effectively bridging the gap between abstract requirements and concrete visual models.
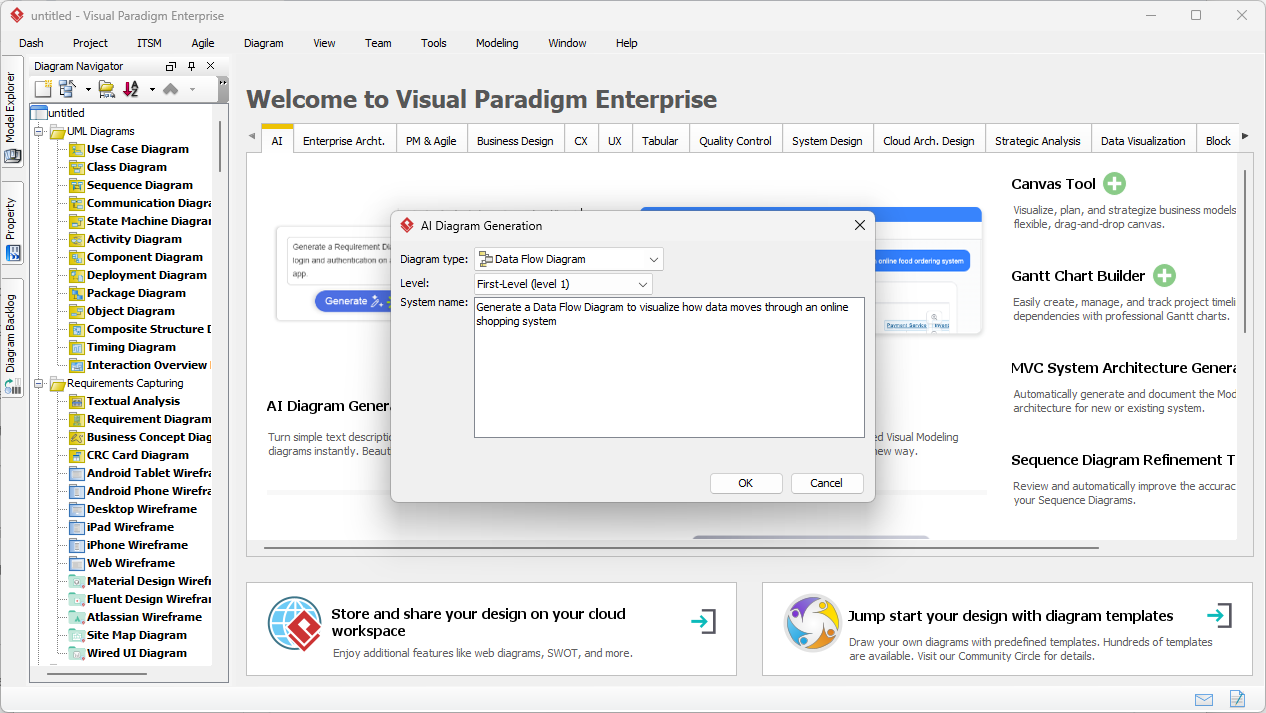
The first image presented illustrates the intuitive interface of the AI Diagram Generation tool within the Visual Paradigm Desktop environment. In this scenario, a professional is preparing to model an online shopping system. Rather than starting with a blank canvas and dragging individual symbols, the user interacts with a streamlined dialog box. This easy-to-use DFD tool prompts the user for a system name and a description of the desired logic. By entering a prompt such as “Generate a Data Flow Diagram to visualize how data moves through an online shopping system,” the analyst sets the stage for the artificial intelligence to perform the heavy lifting of identifying entities, processes, and data stores.
Quick Summary: Key Takeaways of AI DFD Generation
-
Instant Visualization: Transforms natural language descriptions into professional-grade diagrams in seconds.
-
Multiple Notations: Supports standard, Gane-Sarson, Yourdon & Coad, and Yourdon DeMarco styles.
-
Automated Logic: Intelligently infers external entities, data processes, and data stores from text.
-
Full Editability: The output is a native Visual Paradigm diagram, allowing for manual refinement and scaling.
-
Enhanced Accuracy: Minimizes human error in flow direction and labeling during the initial design phase.
The Mechanics of Professional AI-Powered DFD Software
A Data Flow Diagram is more than just a collection of shapes; it is a rigorous map of a system’s functional decomposition. For those who are new to the discipline, a DFD consists of four primary components: External Entities (sources or destinations of data), Processes (actions that transform data), Data Stores (where data is held), and Data Flows (the paths data takes). When using a professional system analysis tool like Visual Paradigm, the AI understands these relationships deeply. It does not merely draw pictures; it constructs a logical model where every arrow represents a specific data item moving between functional units.
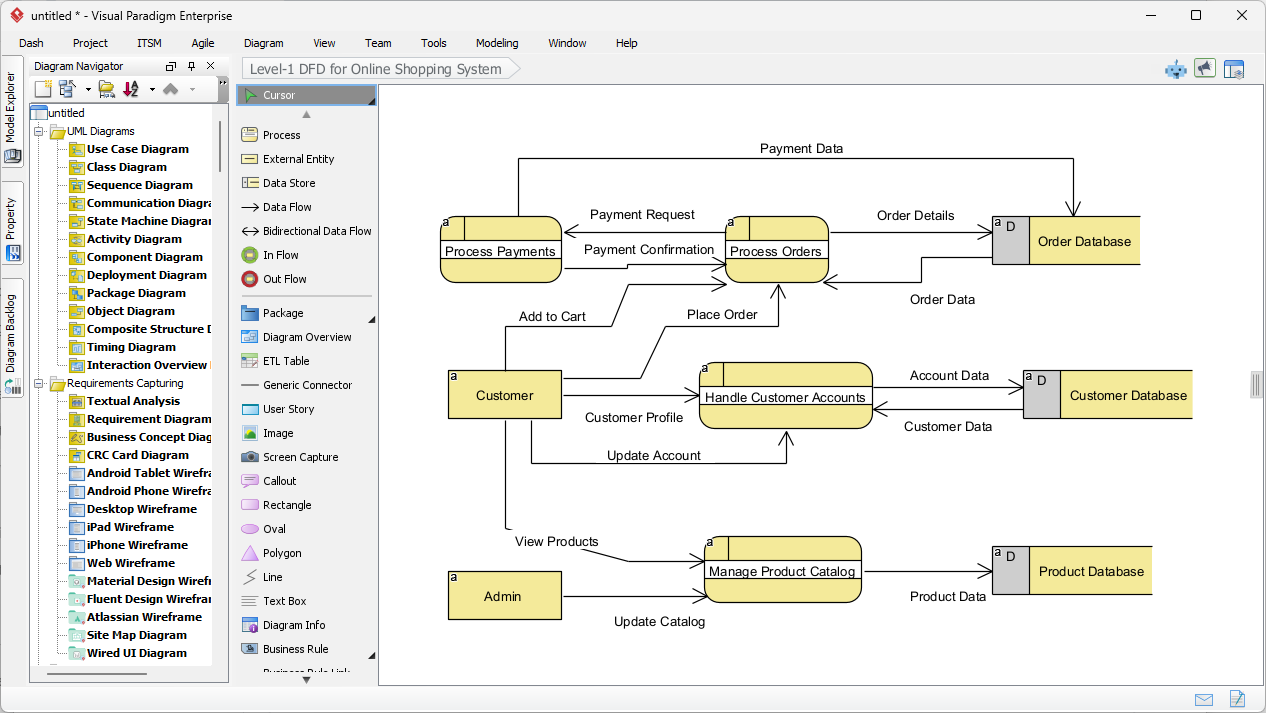
As demonstrated in the second image, the AI has successfully interpreted the user’s request to create a Level-1 DFD for an online shopping system. The result is a clean, organized layout that follows the Gane-Sarson notation style, characterized by rounded rectangles for processes and open-ended rectangles for data stores. The diagram clearly depicts how a “Customer” interacts with the “Process Orders” function, how “Account Data” is retrieved from the “Customer Database,” and how the “Admin” entity manages the “Product Catalog.” This level of detail is generated instantly, providing a high-quality starting point for further system decomposition.
Step-by-Step Tutorial: Generating Your First AI DFD
To achieve the professional results shown in the visual assets, follow this structured workflow within the Visual Paradigm Desktop application. This process is designed to be efficient, ensuring that analysts can focus on high-level logic rather than the minutiae of diagramming aesthetics.
Step 1: Accessing the AI Diagram Generation Tool
Begin by launching Visual Paradigm Desktop and opening your current project. Navigate to the main menu and select Tools > AI Diagram Generation. This action will open the centralized hub for all AI-driven modeling tasks. It is essential to ensure you are in a project where you wish the new diagram to reside, as the tool will automatically integrate the generated output into your project tree for future reference.
Step 2: Defining the Scope and Style
Within the AI Diagram Generation window, you must first select “Data Flow Diagram” from the diagram type dropdown menu. One of the most significant advantages of this AI-powered DFD software is its versatility in notation. You may choose between several industry-standard styles, such as Gane-Sarson (popular in information systems) or Yourdon & Coad (often used in software engineering). For the “Level” field, you can specify whether you require a Context Diagram (Level 0) for a high-level overview or a Level 1 diagram for more detailed process analysis.
Step 3: Entering the System Description
This is the most critical stage of the process. Provide a clear, detailed description of how data moves through your system. For example, if you are modeling a “Payment Processing System,” you should mention that the “User” provides “Credit Card Info,” the “Validation Process” checks the “Bank Database,” and a “Receipt” is sent back to the “User.” The more descriptive your input, the more accurate the resulting professional DFD will be. Once your description is complete, click the “OK” button to initiate the generation.
Step 4: Reviewing and Refining the Output
After the AI processes your text, the diagram will open directly in the Visual Paradigm editor. As seen in the example of the Online Shopping System, the AI handles the automatic layout and readability, ensuring that flow lines do not cross unnecessarily. You should review the diagram to ensure all entities and stores are correctly identified. Because the output is a native diagram, you can easily double-click any element to rename it, add new data flows, or move components to better suit your documentation standards.
Advanced Modeling: Decomposition and Integration
In a professional environment, a single diagram is rarely sufficient to describe an entire enterprise system. Visual Paradigm supports level-by-level decomposition, allowing you to take a high-level process from your AI-generated diagram and “explode” it into a more detailed sub-diagram. This hierarchical approach ensures that your documentation remains organized and manageable, regardless of the system’s complexity. Furthermore, these DFDs can be linked to other models within the software, such as Use Case Diagrams or Entity Relationship Diagrams (ERD), creating a cohesive and traceable requirements set.
Using an online-capable desktop tool for this purpose provides a significant advantage over static drawing applications. The intelligence behind the generation understands the semantic meaning of “Data Store” versus “External Entity,” which prevents logical errors that are common when beginners manually select shapes. It effectively acts as an expert consultant, guiding the user toward a standards-compliant model while saving hours of tedious effort.
Conclusion: The Future of Efficient System Design
The integration of artificial intelligence into the diagramming workflow represents a massive leap forward for business analysts and software architects. By utilizing the best AI DFD generator features in Visual Paradigm, professionals can move from concept to visual model with unprecedented speed. This not only improves productivity but also enhances communication with stakeholders by providing clear, accurate visuals that everyone can understand. Whether you are documenting a legacy system or architecting a new digital platform, the AI Data Flow Diagram generation feature provides the professional results necessary for modern business demands.
Are you ready to streamline your systems analysis and requirements gathering process? Experience the power of AI-driven modeling firsthand and see how quickly you can turn complex descriptions into actionable diagrams.
Experience the innovation yourself: Download Visual Paradigm and start generating professional Data Flow Diagrams with the power of AI today.
Related Links
Data flow diagrams (DFD) graphically represent the movement of data within a system, illustrating key processes, data stores, and external entities to simplify the understanding of information transfers. Modern AI-powered generators have expanded these capabilities, allowing for the instant creation of editable DFDs directly from natural language descriptions.
-
Interactive Data Flow Diagram Maker Tool: This tool provides a user-friendly interface for building professional and clear data flow models.
-
Free Online DFD Drawing Solution: A browser-based solution that allows teams to create and share DFDs without requiring any software installation.
-
What is Data Flow Diagram? – Visual Paradigm Guide: An in-depth overview explaining the core components and strategic role of DFDs in business process analysis.
-
How to Create Data Flow Diagram (DFD)? – Visual Paradigm Tutorial: A practical guide detailing how to use standard symbols and notations to map system information transfers.
-
Step-by-Step DFD Tutorial Guide: A beginner-friendly resource that walks users through the essential steps of creating effective data flow models.
-
Mastering Data Flow Diagrams with Visual Paradigm: An advanced guide focusing on utilizing specialized modeling tools to build complex and precise data flow structures.
-
Demystifying Information Flow with DFDs: This article explains how DFDs clarify the movement of information across various system components for architectural clarity.
-
AI-Powered Instant Creation of DFDs: This resource explores how AI diagram generators can instantly create editable DFDs from text prompts.
-
Advanced Data Flow Diagram Tool Features: An overview of professional functionalities available for creating and sharing technically precise DFDs.
-
Data Flow Diagram Templates – Visual Paradigm Gallery: A collection of ready-to-use templates designed to speed up the modeling of system information flows.