


Timing is the invisible thread that binds hardware and software together. In embedded systems, microcontrollers, and IoT devices, milliseconds matter. A delay of a few microseconds can cause a system failure, a data loss event, or a safety hazard. To visualize these temporal relationships, engineers turn to UML Timing Diagrams. These diagrams provide a rigorous way to model the behavior of signals over time, ensuring that hardware components and software logic operate in sync.
Modeling hardware-software interfaces requires precision. Unlike standard interaction diagrams, timing diagrams focus on the exact moment signals change state. This guide explores how to construct, interpret, and apply these diagrams in real-world engineering scenarios. We will look at signal transitions, active regions, and timing constraints without relying on specific tools.
⚙️ Understanding the Core Purpose
A UML Timing Diagram is a behavioral diagram that emphasizes the timing constraints of objects and signals. It is particularly useful when the correctness of a system depends on the timing of events rather than just the sequence of messages.
- Temporal Accuracy: It defines when a signal must rise or fall.
- State Monitoring: It tracks the state of an object over a specific time interval.
- Interface Verification: It validates if the hardware meets the expectations of the software.
When designing an embedded controller, the software sends a command, and the hardware must respond within a specific window. If the hardware takes too long, the software might timeout. If it responds too early, the data might be unread. Timing diagrams capture this dance.
📉 Key Components of a Timing Diagram
To build a valid diagram, you must understand the syntax. The notation is standardized, ensuring that any engineer can read the model.
1. Lifelines
A lifeline represents an object or an interface. In hardware-software contexts, lifelines often correspond to:
- Software Tasks: The main loop, interrupt handlers, or drivers.
- Hardware Signals: GPIO pins, bus lines (SPI, I2C), or interrupt lines.
- External Devices: Sensors, actuators, or communication modules.
Each lifeline is a vertical line extending down the diagram. Time flows from top to bottom.
2. The Time Axis
Unlike sequence diagrams, where the focus is on message ordering, timing diagrams have an explicit time axis. This can be absolute time (e.g., milliseconds) or relative time (e.g., clock cycles).
- Absolute Time: Useful for system-level requirements like “response must occur within 50ms”.
- Relative Time: Useful for internal logic, such as “wait 3 clock cycles after start”.
3. Signal States and Values
Signals change between defined states. In digital logic, these are typically 0 and 1. In the diagram, these are represented by horizontal bars on the lifeline.
- Active State: A filled bar indicating the signal is high or asserted.
- Passive State: An empty space or a dashed line indicating the signal is low or de-asserted.
- Unknown: A question mark or specific symbol when the state is undefined.
4. Signal Values
For complex signals like data buses, the diagram may show the actual value being transmitted. This is critical when modeling protocols where specific data patterns trigger specific hardware behaviors.
🔌 Modeling Hardware-Software Interfaces
The intersection of hardware and software is where most timing errors occur. Software assumes hardware behaves predictably; hardware reacts to physical constraints. A timing diagram bridges this gap.
Scenario: GPIO Control and Interrupt Handling
Consider a system where a microcontroller controls a sensor via a General Purpose Input/Output (GPIO) pin. The software must read the sensor data immediately after a trigger.
The following elements are critical:
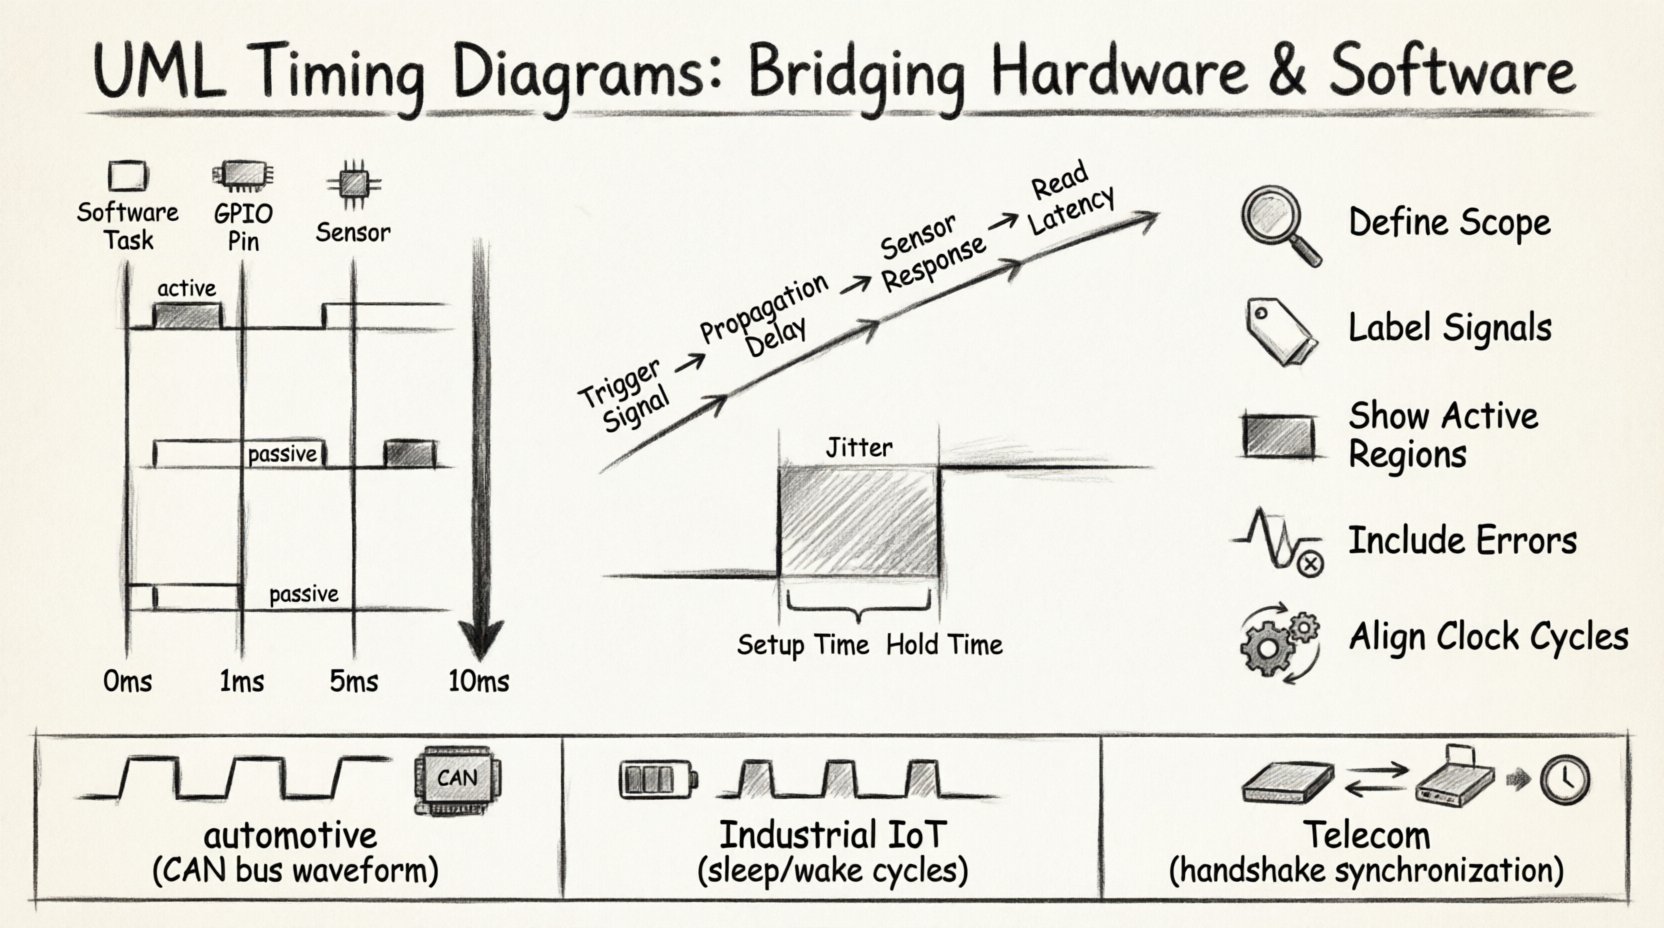
- Trigger Signal: The software writes a value to the GPIO.
- Propagation Delay: The time for the signal to travel through the circuit.
- Sensor Response: The time the sensor takes to stabilize data.
- Read Latency: The time for the CPU to fetch the data.
A timing diagram visualizes the gap between the software write and the hardware read. If the gap is too small, the read might fail. If the gap is too large, the system becomes inefficient.
Scenario: Interrupt Latency
Interrupts are asynchronous events. The diagram must show the transition from the normal execution flow to the interrupt service routine (ISR).
- Interrupt Assertion: The hardware pin goes high.
- Context Switch: The software saves the current state.
- ISR Execution: The handler runs.
- Context Restore: The software resumes the previous task.
Modeling this sequence helps engineers calculate worst-case latency, a critical metric for real-time systems.
📊 Analyzing Timing Constraints
Constraints are the rules that govern the diagram. They ensure that the design meets performance requirements. These are often expressed as inequalities or specific time windows.
Setup and Hold Times
In synchronous systems, data must be stable before and after a clock edge. Timing diagrams explicitly show these windows.
| Constraint Type | Description | Impact on Design |
|---|---|---|
| Setup Time | Time data must be stable before the clock edge. | Requires slower clock or faster hardware. |
| Hold Time | Time data must remain stable after the clock edge. | Requires buffering or slower clock. |
| Propagation Delay | Time for signal to travel from source to destination. | Affects maximum clock frequency. |
Jitter and Variability
Not all events happen at the exact same time. Jitter is the variation in the timing of a signal. In a diagram, this is often shown as a shaded region or a range of possible edges.
- High Jitter: Indicates instability, often due to noise or power supply issues.
- Low Jitter: Indicates a stable, predictable system.
When modeling interfaces, designers must account for worst-case jitter. If the timing window is too narrow, the system becomes unreliable.
🛠️ Best Practices for Effective Modeling
Creating a diagram is easy; creating a useful one requires discipline. Follow these guidelines to ensure clarity and utility.
- Define Scope Clearly: Decide if you are modeling microseconds or seconds. Do not mix granularities without clear scaling.
- Label Signals Explicitly: Use names that match the hardware schematic (e.g.,
INT0,CS_N). - Show Active Regions: Highlight where the signal is driving the load versus when it is floating.
- Include Error Conditions: Show what happens if a timeout occurs. This helps in debugging.
- Align with Clock Cycles: If the system is clocked, align vertical grid lines with clock edges for reference.
Common Pitfalls to Avoid
Avoid these mistakes to save time during the review process.
- Over-complicating: Do not model every single instruction cycle unless necessary. Focus on the interface behavior.
- Ignoring Asynchronous Events: Interrupts and external triggers often break the flow. Ensure they are represented.
- Mixing Levels: Do not mix high-level protocol timing with low-level electrical signaling in the same view.
- Assuming Ideal Conditions: Real hardware has resistance and capacitance. Model delays realistically.
🔄 Integration with Other Diagrams
Timing diagrams do not exist in isolation. They complement other UML diagrams to provide a complete system view.
Sequence Diagrams
Sequence diagrams show the order of messages. Timing diagrams add the dimension of time. Use a sequence diagram to define the flow, then use a timing diagram to validate the timing of critical messages.
State Machine Diagrams
State machines define the logic of an object. Timing diagrams define the duration of states. For example, a state machine might say “Wait for Input”. The timing diagram shows exactly how long that wait is.
Activity Diagrams
Activity diagrams show the workflow. Timing diagrams can be used to annotate specific activities with their execution time. This is useful for performance analysis.
📡 Real-World Scenarios
Let us look at how these diagrams apply to specific industry domains.
1. Automotive Systems
Automotive electronics require strict timing for safety. A braking signal must reach the controller within milliseconds. Timing diagrams are used to verify that the Controller Area Network (CAN) bus meets these latency requirements.
- Focus: Latency and jitter.
- Constraint: Hard real-time requirements.
2. Industrial IoT
IoT devices often operate on limited power. Timing diagrams help optimize sleep cycles. The software can be modeled to wake up the hardware only when necessary, reducing power consumption.
- Focus: Power state transitions.
- Constraint: Energy efficiency.
3. Telecommunications
Network protocols rely on precise synchronization. Timing diagrams model the handshake between devices to ensure data integrity over long distances.
- Focus: Propagation delay and synchronization.
- Constraint: Data throughput.
🔍 Verification and Validation
Once the diagram is created, it must be validated. This process ensures the model matches the physical implementation.
Simulation
Use simulation environments to test the timing logic. Feed input signals and observe the output against the diagram. Discrepancies indicate design flaws.
Static Analysis
Review the diagram for logical consistency. Are there any signals that change state without a trigger? Are there deadlocks where a wait state lasts indefinitely?
Code Review
Compare the implementation code with the diagram. Does the code include the necessary delays? Does it handle interrupts with the correct priority? The diagram serves as the reference document.
📝 Summary of Practices
Effective modeling of hardware-software interfaces requires a deep understanding of both domains. Timing diagrams provide the necessary clarity.
- Clarity: Ensure lifelines and signals are clearly labeled.
- Precision: Use accurate time units and constraints.
- Completeness: Include error paths and asynchronous events.
- Consistency: Keep the diagram in sync with code and schematics.
By adhering to these principles, teams can reduce integration risks and ensure robust system performance. The effort invested in modeling pays off during debugging and maintenance phases.
🚀 Final Considerations
The landscape of embedded systems continues to evolve. As devices become more complex, the need for precise timing models increases. UML Timing Diagrams offer a standardized language to discuss these complexities.
When you begin your next project, start by mapping the critical interfaces. Identify where timing is non-negotiable. Use the diagram to set expectations for the hardware team and the software team. This shared understanding prevents miscommunication and accelerates development.
Remember that a diagram is a living document. Update it as the design changes. If a new constraint is added, reflect it in the model. This keeps the documentation accurate and valuable throughout the lifecycle of the product.
With the right approach, timing diagrams become more than just documentation. They become a tool for analysis, a guide for implementation, and a standard for quality assurance. Embrace the precision they offer to build systems that are reliable, efficient, and robust.