


Software systems that handle concurrency are inherently complex. When multiple threads or processes interact, the order of events matters. A race condition occurs when the behavior of a system depends on the relative timing of events, such as the order in which threads execute or messages are received. These timing issues can lead to unpredictable results, data corruption, or system failures that are notoriously difficult to reproduce. 🛑
To mitigate these risks, engineers rely on visual modeling techniques. The Unified Modeling Language (UML) provides a standardized way to represent system behavior. Among the various diagram types, the UML Timing Diagram offers a precise view of how objects change state over time. By using this tool, you can visualize the temporal relationships between events and identify potential conflicts before code is written. This guide explores how to leverage timing diagrams to prevent race conditions effectively.
⚡ Understanding Race Conditions in Concurrent Systems
A race condition is a defect in a system where the outcome depends on the sequence or timing of uncontrollable events. In software architecture, this often happens when two or more processes attempt to access shared resources simultaneously without proper synchronization. The result is often a state that violates the invariants of the system.
Common scenarios include:
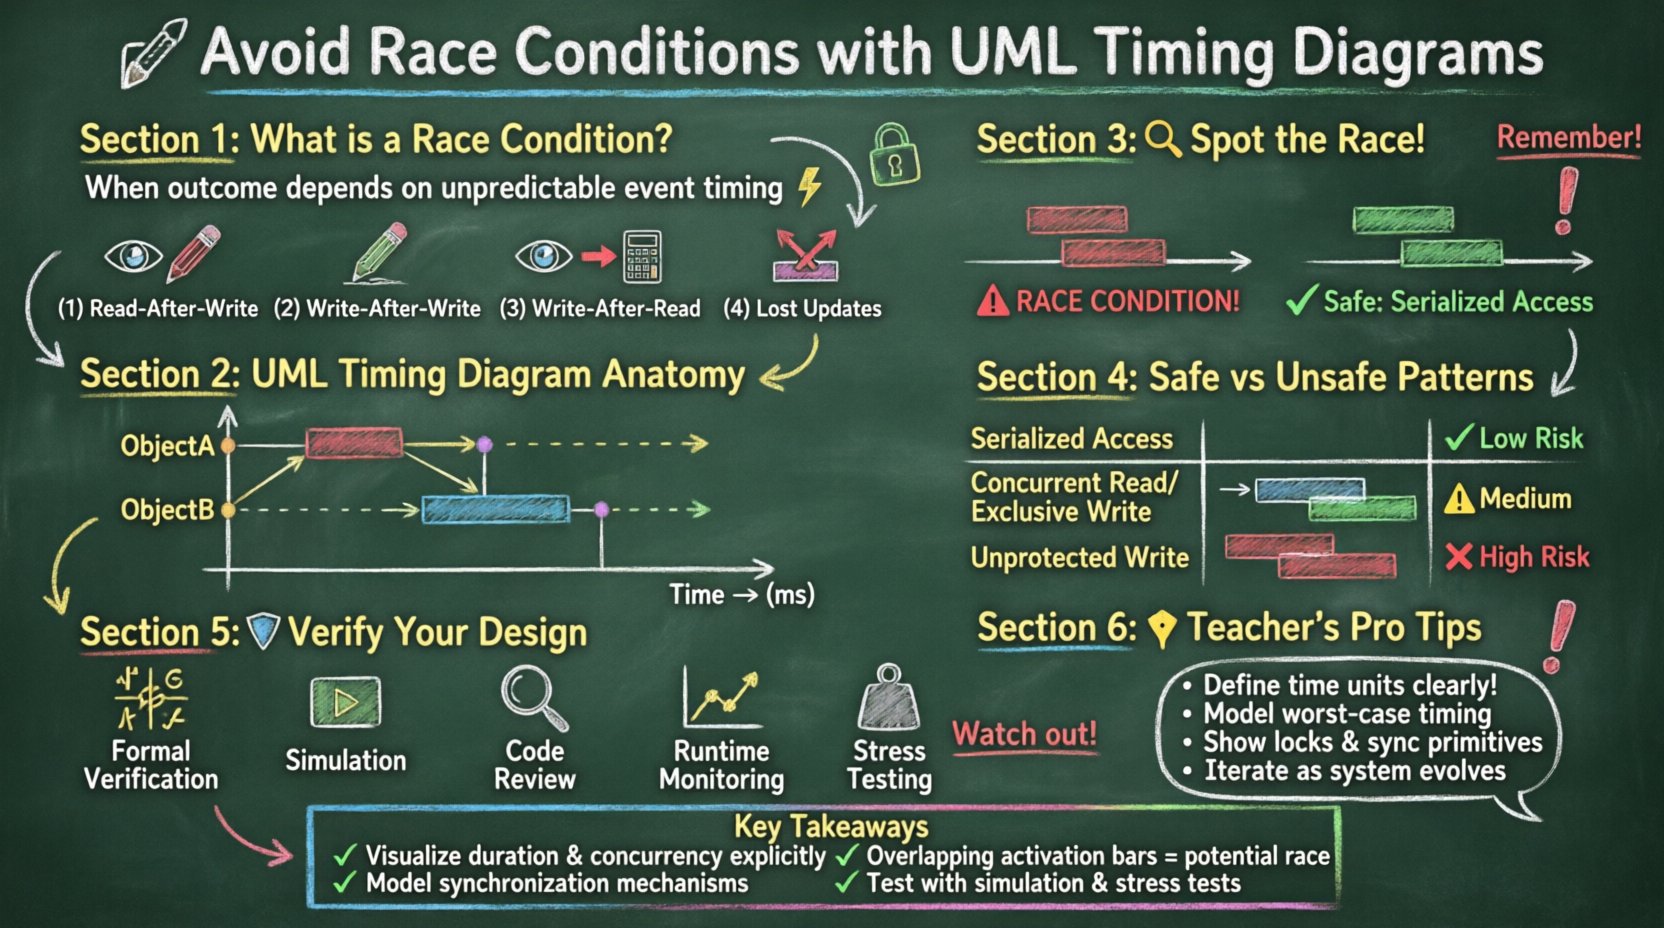
Read-After-Write: A process reads data that another process is currently writing, resulting in partial or corrupted data.
Write-After-Write: Two processes write to the same memory location, causing the final value to be indeterminate.
Write-After-Read: A process reads data, performs a calculation, and writes back, but a concurrent write interrupts this process, leading to a loss of updates.
Lost Updates: Two processes read the same value, update it independently, and write back. The second write overwrites the first, losing the first update.
These issues are not always visible in standard sequence diagrams. Sequence diagrams focus on the order of messages but often abstract away the actual duration of operations. Timing diagrams, conversely, introduce a time axis, allowing you to model duration, delays, and concurrency explicitly.
📐 The Role of UML Timing Diagrams
A UML Timing Diagram is a behavioral diagram that shows the changes in state or value of objects over time. It is particularly useful for real-time systems, embedded software, and any architecture where time constraints are critical. Unlike other diagrams, the horizontal axis represents time, and the vertical axis represents the objects or lifelines.
This structure allows you to see:
When an object is active.
How long a specific operation takes.
The exact moment an event occurs relative to another.
Whether two operations overlap in a way that creates a conflict.
By mapping out the lifecycle of objects on a timeline, you can spot overlaps where race conditions are likely to emerge. It transforms abstract timing risks into visual patterns that can be analyzed and corrected.
🔍 Anatomy of a Timing Diagram
To use this diagram effectively, you must understand its core components. Each element serves a specific purpose in defining temporal behavior.
1. Time Axis
The horizontal axis represents the progression of time. It can be linear or non-linear, depending on the model. Units of time (milliseconds, seconds, clock cycles) are usually defined at the top of the diagram. This axis allows you to measure durations and intervals between events.
2. Object Lifelines
Vertical lines represent the objects or instances involved in the interaction. Each lifeline shows the existence of the object over the time period being modeled. If an object does not exist during a certain interval, the lifeline stops or is dashed.
3. Time Bars
Time bars are horizontal bars placed on a lifeline. They indicate the duration of a specific condition or state. For example, a time bar might show that a variable holds a specific value for a set period. The start and end of the bar correspond to the time values on the axis.
4. Activation Bars
Similar to sequence diagrams, activation bars show when an object is performing an operation. A vertical bar on a lifeline indicates that the object is busy executing a method or handling an event. The length of the bar represents the duration of that execution.
5. Messages
Messages are represented by arrows crossing between lifelines. In timing diagrams, messages have a specific time of occurrence. They can be synchronous (waiting for a return) or asynchronous (fire and forget). The position of the arrow tail and head indicates the exact moment the message is sent and received.
🔍 Detecting Race Conditions Visually
Once you understand the components, you can begin to analyze the diagram for race conditions. The visual nature of the timing diagram makes it easier to spot timing violations that might be hidden in code.
Identifying Overlapping Writes
Look for activation bars on different lifelines that overlap horizontally. If two processes are writing to a shared resource during the same time interval, a race condition exists. The diagram should show synchronization mechanisms, such as a lock or a mutex, being acquired before the write operation begins.
Checking State Consistency
Use time bars to track the state of shared variables. If a variable changes state (e.g., from Idle to Processing) while another process expects it to remain Idle, you have a potential conflict. Ensure that state transitions are atomic or protected by synchronization primitives.
Analyzing Message Crossing
Examine the points where messages cross lifelines. If a message triggers a state change, ensure that the receiving object is in the correct state to handle it. If the message arrives while the object is in the middle of another operation, the state might be invalid.
🚧 Common Pitfalls in Timing Modeling
Creating a timing diagram is not a silver bullet. There are common mistakes that can lead to false confidence or missed issues. Being aware of these pitfalls helps in building more accurate models.
Ignoring Execution Time: Assuming operations happen instantly. In reality, every function call takes time. Ignoring this can hide race conditions where a resource is released too early.
Over-simplifying Concurrency: Modeling only the happy path. You must model error conditions, timeouts, and retries. These often introduce timing variations that trigger races.
Missing Clock Drift: In distributed systems, clocks may not be perfectly synchronized. A model that assumes perfect synchronization might miss races caused by clock skew.
Static Time Values: Using fixed time values when the actual time is variable. If a process takes 10ms on average but can take 50ms, your model needs to account for the worst-case scenario.
Ignoring Context Switching: In multi-threaded environments, the operating system may pause a thread. The timing diagram should reflect potential interruptions.
📊 Comparison of Safe vs. Unsafe Patterns
The following table illustrates the difference between safe and unsafe timing patterns in a concurrent system.
Pattern | Description | Timing Diagram Indicator | Risk Level |
|---|---|---|---|
Serialized Access | Only one process accesses the resource at a time. | Activation bars are sequential, not overlapping. | Low |
Concurrent Read, Exclusive Write | Multiple reads allowed, but writes require a lock. | Read bars overlap; Write bars are isolated. | Medium |
Unprotected Write | Multiple processes write to the same variable without locks. | Write activation bars overlap horizontally. | High |
Lock Timeout | Processes wait for a lock but give up after a set time. | Wait bars end with a timeout marker before lock acquisition. | Medium |
Lock Ordering | Processes acquire locks in a consistent order. | Lock acquisition bars follow a strict sequence. | Low |
🛡️ Strategies for Verification
Once you have identified potential issues in your diagram, you need strategies to verify that the implementation matches the model. Verification ensures that the timing constraints hold true in the actual system.
1. Formal Verification
Use formal methods to mathematically prove that the system meets its timing requirements. This involves creating a mathematical model of the system and checking it against the timing constraints defined in the diagram. This is rigorous but requires specialized tools.
2. Simulation
Run simulations of the system using the timing diagram as a reference. You can inject timing variations to see how the system reacts. This helps identify edge cases where race conditions might occur under stress.
3. Code Review
Review the code to ensure it implements the synchronization mechanisms shown in the diagram. Check for missing locks, incorrect timeout values, or race-prone patterns like double-checked locking without proper volatile declarations.
4. Runtime Monitoring
Implement logging and monitoring in the deployed system. Track the timestamps of critical events. If the runtime data deviates significantly from the timing diagram, investigate immediately. This provides real-world validation of the model.
5. Stress Testing
Subject the system to high load and concurrent access. Stress testing can reveal race conditions that only appear under specific conditions. Ensure the timing constraints remain valid even when the system is under pressure.
🔄 Handling Concurrency and Parallelism
Concurrency is the execution of multiple processes in overlapping time periods. Parallelism is the actual simultaneous execution. Timing diagrams are essential for modeling both, but they require careful attention to resource sharing.
1. Shared Resources
When multiple processes access the same resource, synchronization is mandatory. The timing diagram should explicitly show the acquisition and release of locks. If a resource is shared, ensure that the active periods of the processes do not overlap without protection.
2. Deadlocks
A deadlock occurs when two or more processes are waiting for each other to release resources. While timing diagrams focus on time, they can help visualize deadlocks by showing circular wait conditions. Look for cycles where Process A waits for B, and B waits for A, indefinitely.
3. Priority Inversion
Priority inversion happens when a low-priority task holds a lock needed by a high-priority task. The timing diagram can show the high-priority task waiting while a low-priority task is active. This helps identify where priority inheritance mechanisms are needed.
📝 Data Exchange and State Consistency
Data exchange between processes must be consistent. If Process A sends a message containing data to Process B, Process B must receive the data before it changes state. Timing diagrams help ensure this by showing the exact moment the data is valid.
Message Validity: Define the duration for which a message is valid. If the data expires before it is processed, the system must handle the timeout.
State Transitions: Ensure that state transitions are triggered only when the necessary data is available. Use guard conditions on the transitions to enforce this.
Buffering: If data arrives faster than it can be processed, a buffer is needed. The timing diagram should show the buffer filling and emptying over time.
🛠️ Best Practices for Diagramming
To maximize the effectiveness of UML timing diagrams, follow these best practices.
Start Simple: Begin with the core flow before adding complexity. Add concurrency and timing details gradually.
Define Units: Clearly specify the time units used (ms, s, cycles) to avoid confusion.
Label Events: Give every event a descriptive name. Avoid generic labels like “Event 1”.
Use Comments: Add comments to explain complex timing constraints or exceptions.
Iterate: Update the diagram as the system evolves. A static diagram becomes obsolete quickly.
Validate with Stakeholders: Review the diagram with the development team to ensure it matches their understanding of the system.
🎯 Summary of Key Takeaways
Preventing race conditions requires a deep understanding of system timing. UML timing diagrams provide a visual language to model these relationships. By focusing on the time axis, activation bars, and message crossing, you can identify conflicts that would otherwise be hidden in code.
Key points to remember include:
Use timing diagrams to visualize duration and concurrency explicitly.
Look for overlapping activation bars as indicators of potential race conditions.
Ensure synchronization mechanisms are modeled alongside the operations.
Account for worst-case execution times and clock drift.
Verify the model through simulation, testing, and code review.
By integrating these diagrams into your design process, you build systems that are more robust and predictable. The effort spent modeling timing pays off in reduced debugging time and higher system reliability. 🚀