

Understanding complex system behaviors requires precise modeling tools. Among the Unified Modeling Language (UML) family, the timing diagram stands out for its unique ability to represent time-dependent behavior. Unlike other diagrams that focus primarily on structure or static interactions, this specific view captures the temporal relationships between objects. This guide provides a detailed examination of every symbol found in a UML timing diagram, explaining their function and implications for system design.
When engineers model real-time systems, embedded software, or concurrent processes, visualizing time is crucial. A timing diagram maps the state of objects over a timeline. It allows stakeholders to see exactly when a condition changes, how long an operation takes, and whether deadlines are met. This document breaks down the notation to ensure clear communication during the design phase.
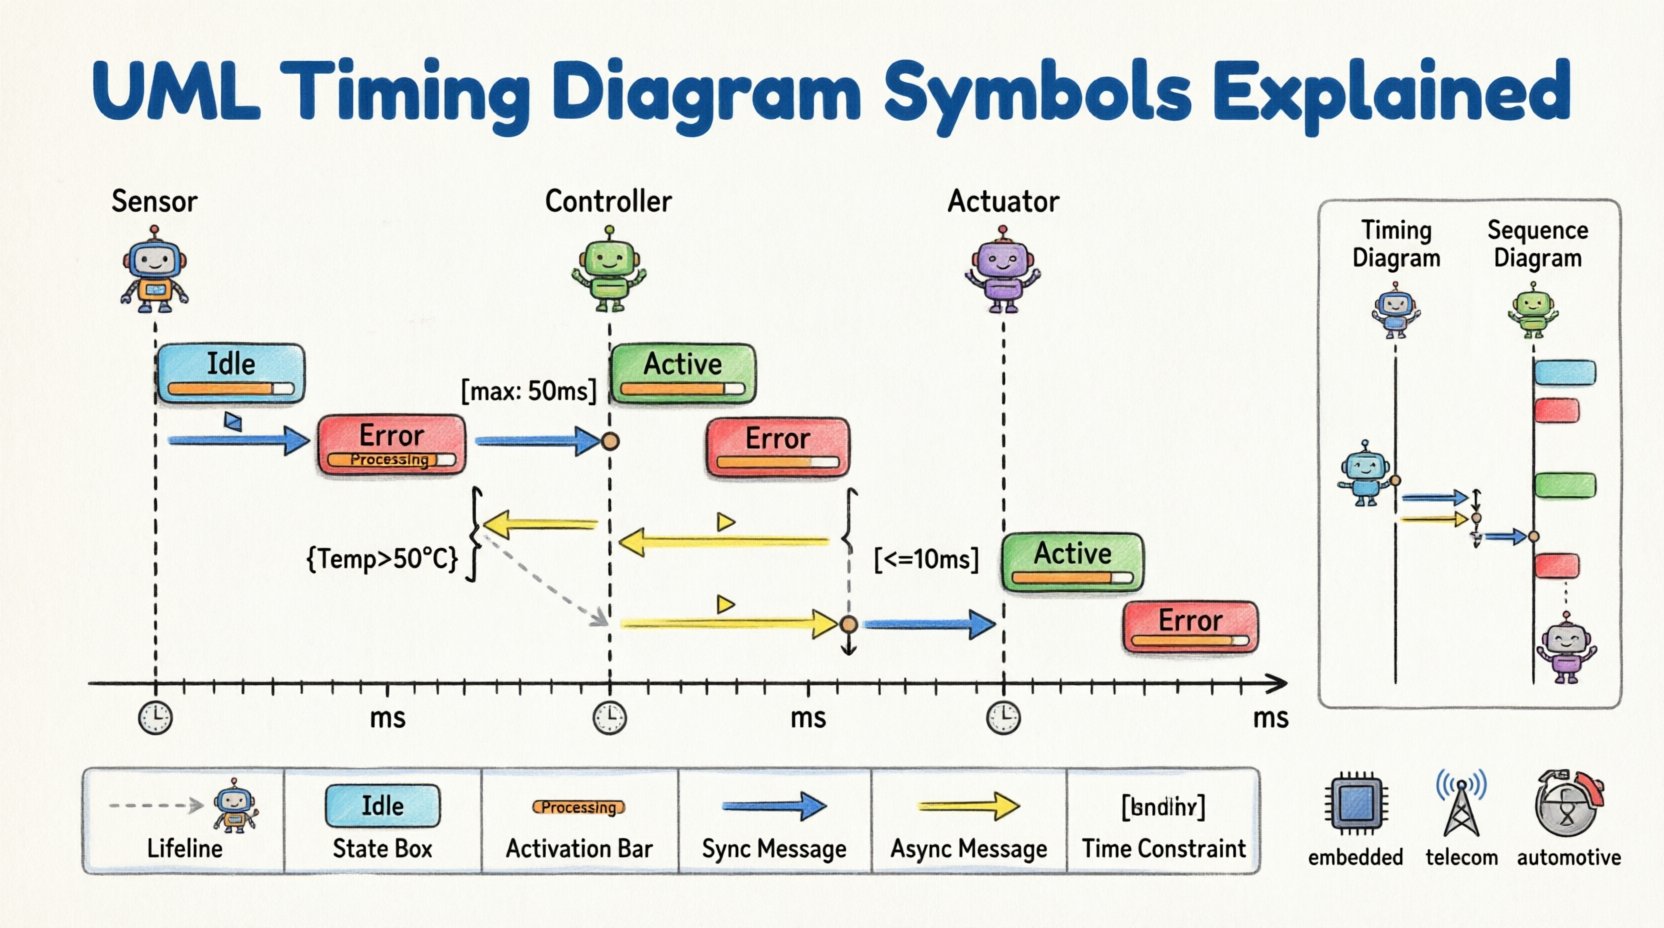
Core Structure of a Timing Diagram ⚙️
Before analyzing individual symbols, it is essential to understand the canvas upon which they are drawn. The layout follows a standard convention that enables consistent interpretation across different modeling contexts.
- Vertical Axis (Lifelines): Represents distinct objects or system components.
- Horizontal Axis (Time): Represents the progression of time, moving from left to right.
- State Fragments: Rectangular shapes placed on lifelines indicating conditions.
- Messages: Arrows showing interactions between lifelines.
The orientation is critical. Time flows horizontally, which distinguishes this diagram from a sequence diagram where time flows vertically. This horizontal progression allows for the explicit marking of specific time points and intervals.
Lifelines: The Foundation of Time ⏳
The lifeline is the vertical line that anchors the diagram. It represents a single participant in the interaction. In the context of timing, this participant exists throughout the timeline shown.
Characteristics of a Lifeline
- Existence: It indicates that the object is active and capable of responding to events.
- Positioning: Placed at the top, the name of the object usually appears here.
- Continuity: The line continues unless the object is destroyed or removed from the scope.
Unlike a sequence diagram, where a lifeline might be drawn as a dashed line if the object is not present, a timing diagram lifeline implies the scope of the observation. If a lifeline stops, it often signifies the end of the observation period for that specific component, not necessarily destruction.
Time Axis and Scale 📏
The horizontal axis defines the temporal dimension. While not always drawn as a continuous ruler, the concept of time progression is fundamental to the diagram’s logic.
- Direction: Time always moves from left to right.
- Scale: Units can be arbitrary (ticks) or specific (milliseconds, seconds), depending on the system requirements.
- Markers: Vertical dashed lines often mark specific time points of interest.
When reading the diagram, the distance between events on the horizontal axis represents duration. A gap between two events implies a period of inactivity or delay. This visual spacing helps engineers identify bottlenecks or latency issues within the system.
State Representations and Conditions 🟦
The most distinct feature of a timing diagram is the use of state boxes along the lifelines. These shapes communicate the internal status of the object over time.
State Boxes
These are rectangular regions drawn on the lifeline. They indicate that the object is in a specific state during that time interval.
- Active State: The object is performing an action or waiting for a result.
- Passive State: The object is idle or waiting for an external trigger.
- Duration: The width of the box corresponds to the time spent in that state.
Transitions between states are often indicated by changes in the box color or pattern. For example, a box might be shaded to indicate a high-priority task, while an unshaded box indicates a background process.
Conditions and Constraints
Text labels within or near state boxes often specify conditions. These are boolean expressions that must be true for the state to be active.
- Example: [Temperature > 50C] indicates the system is in an overheat state only when this condition is met.
- Timing Constraints: Text may specify deadlines, such as [<= 10ms], indicating the maximum time allowed for a specific action.
Activation Bars and Execution Specifiers 📊
Similar to the execution specification in a sequence diagram, the timing diagram uses activation bars to show when an object is busy. However, in a timing context, this is strictly about time duration.
Visual Representation
An activation bar is a thin rectangle placed directly on the lifeline. It highlights a period of intense activity.
- Busy Indicator: Shows the system is occupied with a specific task.
- Concurrency: Multiple activation bars on the same lifeline can show parallel processing.
- Overlap: Bars may overlap with other lifelines to show interaction during the active period.
Distinguishing from State Boxes
It is important to differentiate between a state box and an activation bar. A state box describes the *status* of the object (e.g., “Locked”), while an activation bar describes the *action* being performed (e.g., “Processing Data”). Often, an activation bar sits inside a state box, indicating the action is happening while the object remains in that specific state.
Messages and Events 💬
Interactions between objects are depicted using arrows. In a timing diagram, these arrows are often horizontal or diagonal, crossing the time axis.
Signal and Call
- Solid Arrow: Represents a synchronous call or message. The sender waits for a response.
- Open Arrow: Represents an asynchronous signal. The sender does not wait for a response.
- Return Arrow: Indicates a response returning to the sender.
Event Markers
Events are specific points in time where something significant happens. They are often marked with small circles or specific symbols at the intersection of a lifeline and a message.
- Trigger: An event that initiates a state change.
- Occurrence: The actual firing of the event.
Time Constraints and Fragments ⏱️
Timing diagrams excel at showing constraints. These are formal requirements regarding time that must be satisfied.
Duration Constraints
These specify the maximum or minimum time allowed for an operation.
- Max Duration: Often denoted with a bracket like [max: 50ms].
- Min Duration: Denoted with [min: 20ms].
Interval Constraints
These define the time between two specific events.
- Gap: The time between the end of one message and the start of another.
- Window: A specific time window during which an event must occur.
Symbol Reference Table 📋
To assist with quick reference, the following table summarizes the primary symbols found in a UML timing diagram.
| Symbol Name | Visual Description | Meaning |
|---|---|---|
| Lifeline | Vertical line extending from object name | Represents the participant over time |
| State Box | Rectangle on the lifeline | Object is in a specific state during this interval |
| Activation Bar | Thin rectangle on the lifeline | Object is busy executing an operation |
| Time Axis | Horizontal line at the top | Progression of time (Left to Right) |
| Synchronous Message | Solid arrow with filled head | Call requiring a response before continuing |
| Asynchronous Message | Open arrow head | Signal sent without waiting for response |
| Time Constraint | Text label with brackets | Specific time limit or duration requirement |
| Condition | Text label in braces | Boolean expression required for state validity |
Concurrency and Parallelism ⚡
One of the strongest capabilities of the timing diagram is handling concurrency. Unlike sequence diagrams, which typically show interactions in a single flow, timing diagrams can clearly display parallel processes.
Parallel Lifelines
When multiple lifelines have activation bars at the same horizontal position, it indicates simultaneous execution. This is vital for analyzing system load and resource contention.
- Resource Contention: If two processes try to access the same resource at the same time, the diagram reveals potential conflicts.
- Deadlocks: Waiting states that overlap can indicate where a deadlock might occur.
Interleaving
Tasks can be interleaved. One object might start a task, pause, start another task, and then resume the first. The timing diagram visualizes these gaps and overlaps precisely.
Timing vs. Sequence: Key Differences ⚖️
While both diagrams depict interactions, their focus differs significantly. Confusion between the two can lead to modeling errors.
- Sequence Diagram Focus: Order of messages and object collaboration. Time is implied but not explicit.
- Timing Diagram Focus: Absolute time, durations, and deadlines. Order is secondary to the temporal schedule.
Use a sequence diagram to understand what happens. Use a timing diagram to understand when it happens and for how long.
Reading the Diagram Effectively 📖
Interpreting these diagrams requires a systematic approach to avoid missing critical details.
Step-by-Step Analysis
- Identify the Actors: Look at the top to see which objects are involved.
- Scan the Time Axis: Note the scale and direction. Ensure you understand the units.
- Trace the Lifelines: Follow each vertical line from left to right.
- Check Activation Bars: Identify periods of high activity or blocking.
- Analyze Interactions: Look for messages crossing lifelines and note their timing.
- Verify Constraints: Check for any text labels indicating time limits.
Common Pitfalls
- Ignoring Gaps: Empty space on the timeline is not just whitespace; it represents latency or waiting.
- Mixing Types: Do not mix state changes with message flows without clear distinction.
- Unclear Scale: Always define the time unit to avoid ambiguity.
Application in Real-Time Systems 🖥️
This modeling technique is particularly valuable in domains where timing is critical.
Embedded Systems
In embedded environments, microcontrollers must respond within strict windows. Timing diagrams help verify if the code meets these deadlines before deployment.
Telecommunications
Network protocols rely on timeouts and retransmission schedules. Visualizing these intervals helps engineers optimize network performance.
Automotive Control
Brake systems and engine management units require precise synchronization. The diagram ensures that sensor inputs are processed and outputs are triggered at the exact necessary moments.
Best Practices for Modeling ⭐
To maintain clarity and utility, follow these guidelines when creating these diagrams.
- Keep it Simple: Avoid overcrowding the diagram with too many lifelines. Break complex systems into sub-diagrams.
- Consistent Notation: Use standard shapes for states and messages to ensure readability.
- Label Everything: Every message and state should have a descriptive label.
- Focus on Critical Paths: Highlight the paths that determine system performance or safety.
Advanced Notations and Extensions 🔍
Standard UML provides the foundation, but real-world requirements often necessitate extensions.
Timing Expressions
Complex mathematical expressions can define timing constraints. For example, t = 2 * x + 5 can define a delay based on an input variable.
State Machines Integration
Timing diagrams can be linked with state machine diagrams. This allows a state change in the timing view to trigger a state transition in the state machine view.
Conclusion on Symbol Utility 🎯
Mastering the symbols in a UML timing diagram is a matter of understanding time as a resource. Each line, box, and arrow carries weight regarding system performance and reliability. By adhering to the standard notation and focusing on the temporal relationships, engineers can create models that accurately reflect the behavior of complex systems. The clarity provided by these diagrams reduces ambiguity and supports better decision-making during the development lifecycle.
The symbols described here form the vocabulary of time-based modeling. Whether analyzing a simple request-response cycle or a multi-threaded real-time controller, the principles remain the same. Time is the constant variable, and these diagrams provide the map to navigate it.