


In complex system design, understanding the temporal behavior of components is just as critical as understanding their structural connections. While sequence diagrams show the order of messages, a UML Timing Diagram provides a precise view of changes in state and signals over time. This specific visualization helps engineers validate real-time constraints and ensure synchronization between different parts of a system. However, without discipline, these diagrams can become difficult to read and maintain. This guide details the best practices for creating clear, robust timing specifications.
Understanding the Core Components of a Timing Diagram ⏳
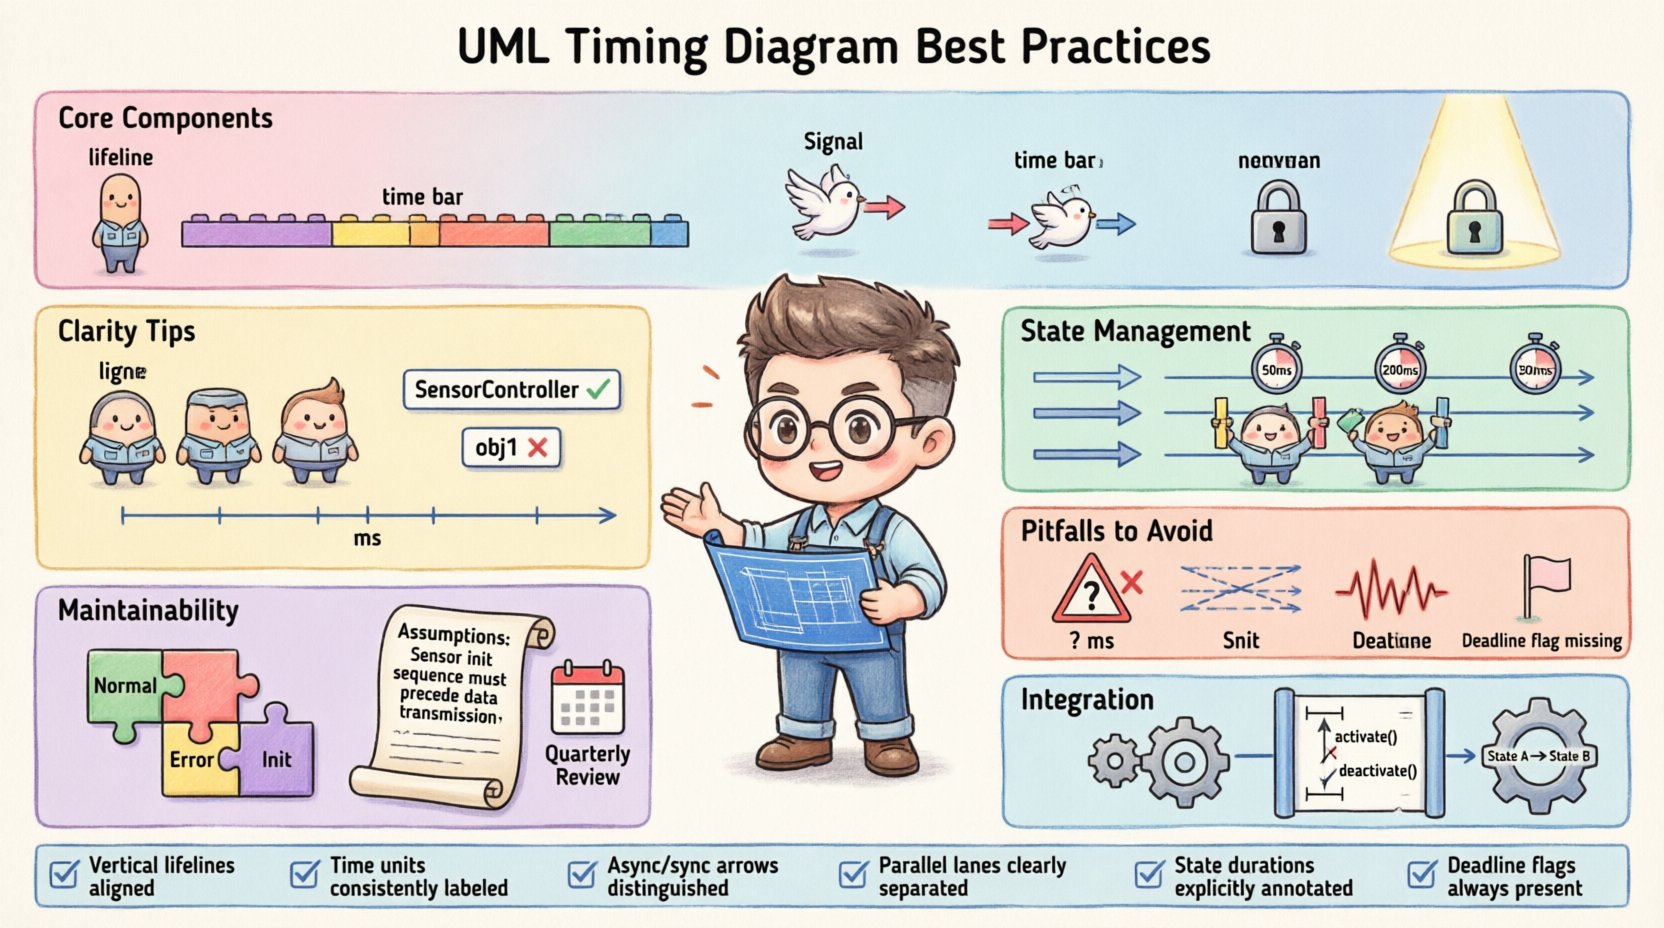
Before establishing best practices, it is essential to understand the building blocks. A timing diagram focuses on time as the primary axis. It typically displays information across a horizontal timeline.
- Lifelines: Vertical lines representing objects, parts, or instances. These track the state of the element over the timeline.
- Time Bars: Horizontal segments along a lifeline indicating the duration an object is active or in a specific state.
- Signals: Arrows or vertical lines showing the transmission of data or events between lifelines.
- State Invariants: Conditions that must hold true for a specific duration on a lifeline.
- Focus of Control: Indicates when an object is actively executing an operation.
By keeping these elements distinct and labeled correctly, the diagram remains readable. Confusing a signal with a state change can lead to significant misunderstandings during the implementation phase.
Structuring for Clarity and Readability 📝
Clarity is the primary goal of any technical documentation. When multiple systems interact, the diagram can become cluttered quickly. The following strategies help manage complexity.
1. Limit Lifelines per Diagram 🧱
Do not attempt to show every single interaction in a single view. If a diagram contains too many lifelines, the relationships become obscured. Split the diagram into logical groups based on subsystems or functional areas.
- Group by Function: Keep sensors together, controllers together, and actuators together.
- Focus on Scope: One diagram should cover a specific sequence or event type, not the entire lifecycle of the system.
- Use References: Refer to other diagrams for details rather than embedding them all at once.
2. Align Time Scales Carefully 📏
Consistency in time units is vital. Mixing milliseconds, seconds, and cycles without clear labels causes confusion. Choose a primary unit for the diagram and stick to it.
- Linear vs. Logarithmic: Most timing diagrams use linear scales. Ensure the spacing between time markers is uniform.
- Explicit Units: Always label the time axis (e.g., ms, s, ticks).
- Alignment: Ensure signals sent from one lifeline align correctly with the receiving lifeline’s time bar.
3. Standardize Naming Conventions 🏷️
Names should be self-explanatory. Avoid abbreviations that are not standard across the team. Use the same naming convention for objects in the timing diagram as used in the class diagram.
| Avoid | Use Instead | Reason |
|---|---|---|
obj1 |
SensorController |
Descriptive names aid understanding without context. |
msg_A |
StartSignal |
Action-oriented names clarify intent. |
state 1 |
Idle |
State names should reflect actual system behavior. |
Managing State and Activity Over Time ⚙️
The interaction between states and activities is where timing diagrams often become ambiguous. Clear representation of these interactions prevents implementation errors.
1. Use State Invariants for Precision 🔒
When an object must remain in a specific state for a defined period, use state invariants. This clarifies that the condition is not just a transient moment but a sustained requirement.
- Duration: Clearly mark the start and end of the state.
- Conditions: Specify any conditions that must be met during this duration.
- Exceptions: Note if the state can be interrupted by external events.
2. Distinguish Between Sending and Receiving 📥📤
Signals travel across time. It is crucial to distinguish between when a signal is sent and when it is received. The sending event occurs at the start of the arrow. The receiving event occurs where the arrow intersects the target lifeline.
- Asynchronous: Use open arrowheads for signals that do not wait for a response immediately.
- Synchronous: Use solid arrowheads for calls that block the caller until the receiver finishes.
- Delay: Explicitly show any processing delay between send and receive if it is critical to the system logic.
3. Handle Concurrency with Care ⚡
When multiple processes run simultaneously, their lifelines must run parallel to the main timeline. Ensure that concurrent lifelines are clearly separated and labeled as parallel segments if necessary.
- Parallel Regions: Use parallel bars to indicate multiple threads or processes running at the same time.
- Shared Resources: If lifelines share a resource, indicate potential contention or locking periods.
- Interference: Show if one process blocks another during a specific time window.
Maintainability and Version Control 🔄
Specifications change. As the system evolves, the timing diagrams must evolve with them. A maintainable diagram reduces the cost of updates.
1. Modularize Complex Interactions 🔗
Do not create a single massive diagram for a complex subsystem. Break the behavior into smaller, logical scenarios.
- Scenario-Based: Create separate diagrams for “Normal Operation”, “Error Handling”, and “Initialization”.
- Reusability: If a timing pattern repeats, document it once and reference it.
- Links: Use hyperlinks or references between diagrams to show relationships without duplication.
2. Document Assumptions and Constraints 📌
Timing diagrams often rely on underlying assumptions about hardware or network latency. Document these outside the visual diagram to keep it clean.
- Latency: Note expected network delays in the diagram legend.
- Hardware Limits: Specify processor speed or clock cycles if relevant to the timing.
- Environment: Mention environmental factors that could affect timing (e.g., temperature, load).
3. Regular Reviews and Updates 🗓️
Schedule regular reviews to ensure the diagrams match the current codebase. Outdated diagrams are more dangerous than no diagrams at all.
- Code Review: Compare diagram behavior against the latest implementation.
- Stakeholder Feedback: Have system architects verify the timing logic.
- Change Logs: Maintain a log of when and why specific timing constraints were changed.
Common Pitfalls to Avoid ⚠️
Even experienced engineers can make mistakes. Recognizing common errors helps prevent them.
- Ambiguous Time Units: Failing to define if time is relative or absolute. Always specify the start point (e.g., System Start, Power On).
- Overlapping Lifelines: Drawing lifelines too close together makes it hard to distinguish signals. Ensure adequate spacing.
- Ignoring Jitter: Assuming perfect timing in real-time systems. Indicate ranges or tolerances where jitter is possible.
- Missing Deadlines: Failing to mark hard deadlines for critical operations. Use vertical markers for deadlines.
Integration with Other UML Diagrams 🔗
A timing diagram does not exist in isolation. It works best when integrated with other modeling artifacts.
1. Relationship with Sequence Diagrams 📜
Sequence diagrams show the logical order of messages. Timing diagrams show the temporal constraints. Use sequence diagrams for high-level flow and timing diagrams for detailed verification.
- Consistency: Ensure the message order in the timing diagram matches the sequence diagram.
- Detail Level: Use the timing diagram to add time constraints to the interactions defined in the sequence diagram.
2. Relationship with State Machine Diagrams 🔄
State machines define the internal logic. Timing diagrams define the external timing constraints on that logic.
- State Duration: Verify that the time spent in a state matches the state machine transitions.
- Entry/Exit: Ensure the timing of entry and exit events aligns with the state transitions.
Checklist for Clear Specifications ✅
Use this checklist before finalizing any timing diagram.
| Check | Status | Notes |
|---|---|---|
| Are all lifelines named clearly? | ☐ | |
| Are time units defined and consistent? | ☐ | |
| Are signals distinguishable from state changes? | ☐ | |
| Are concurrent processes labeled? | ☐ | |
| Are critical deadlines marked? | ☐ | |
| Is the diagram split into logical sections? | ☐ | |
| Are assumptions documented? | ☐ |
Final Thoughts on Specification Quality 🎯
Maintaining high-quality timing specifications requires discipline and consistent application of these practices. The goal is not just to draw a picture, but to create a reliable contract for system behavior. When engineers follow these guidelines, the risk of timing errors decreases significantly. Clear documentation saves time during debugging and reduces the likelihood of integration failures.
Focus on clarity, consistency, and context. By doing so, you ensure that the timing specifications serve as a lasting asset for the development team. Regular updates and adherence to naming conventions will keep the diagrams useful throughout the project lifecycle. Remember, a diagram that is easy to read is a diagram that gets used correctly.